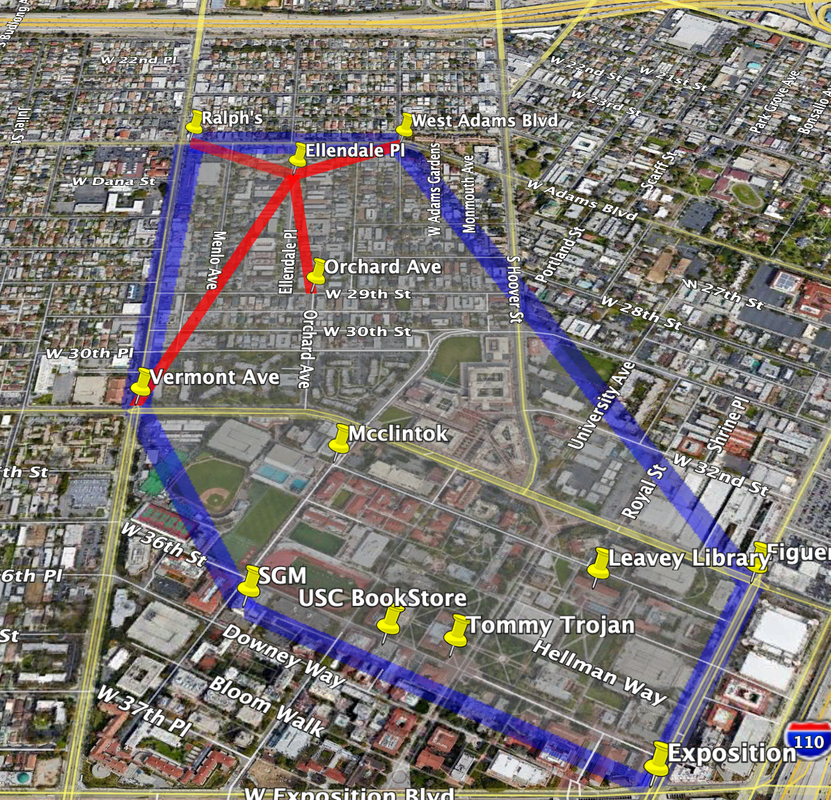
- Analyzed Spatial Datapoints around USC, Los Angeles using POSTGIS
- Plotted a Convex hull using these points and created a google earth based visualization using KML file
- Successfully ran K-nearest neighbor query
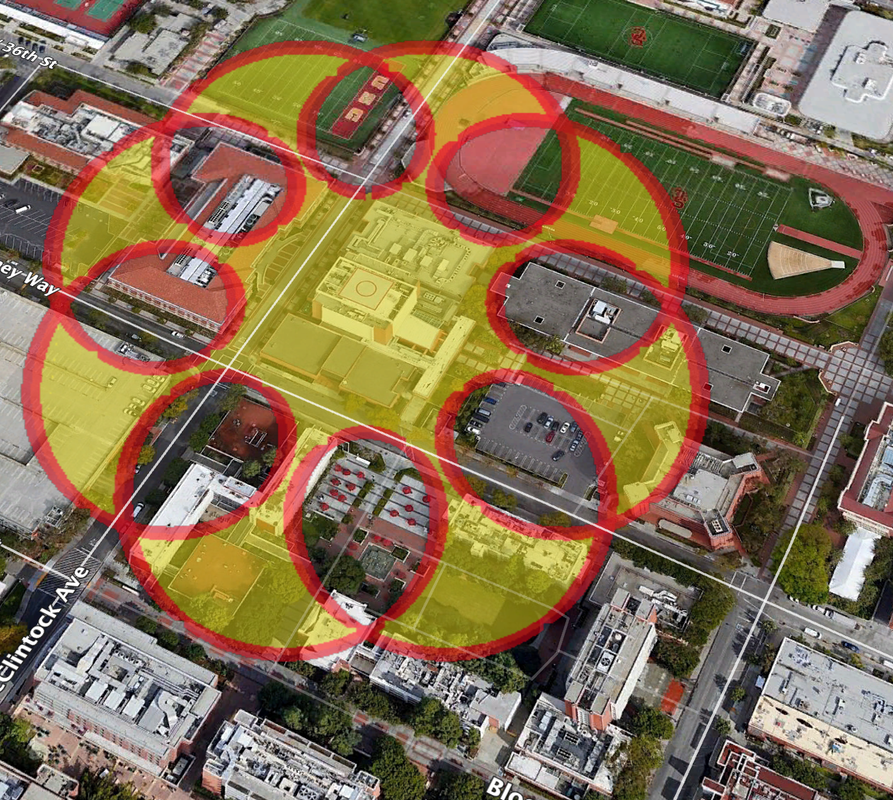
- In addition to the above, plotted the points on ArgGIS and created a Spirograph curve with some Javascript code