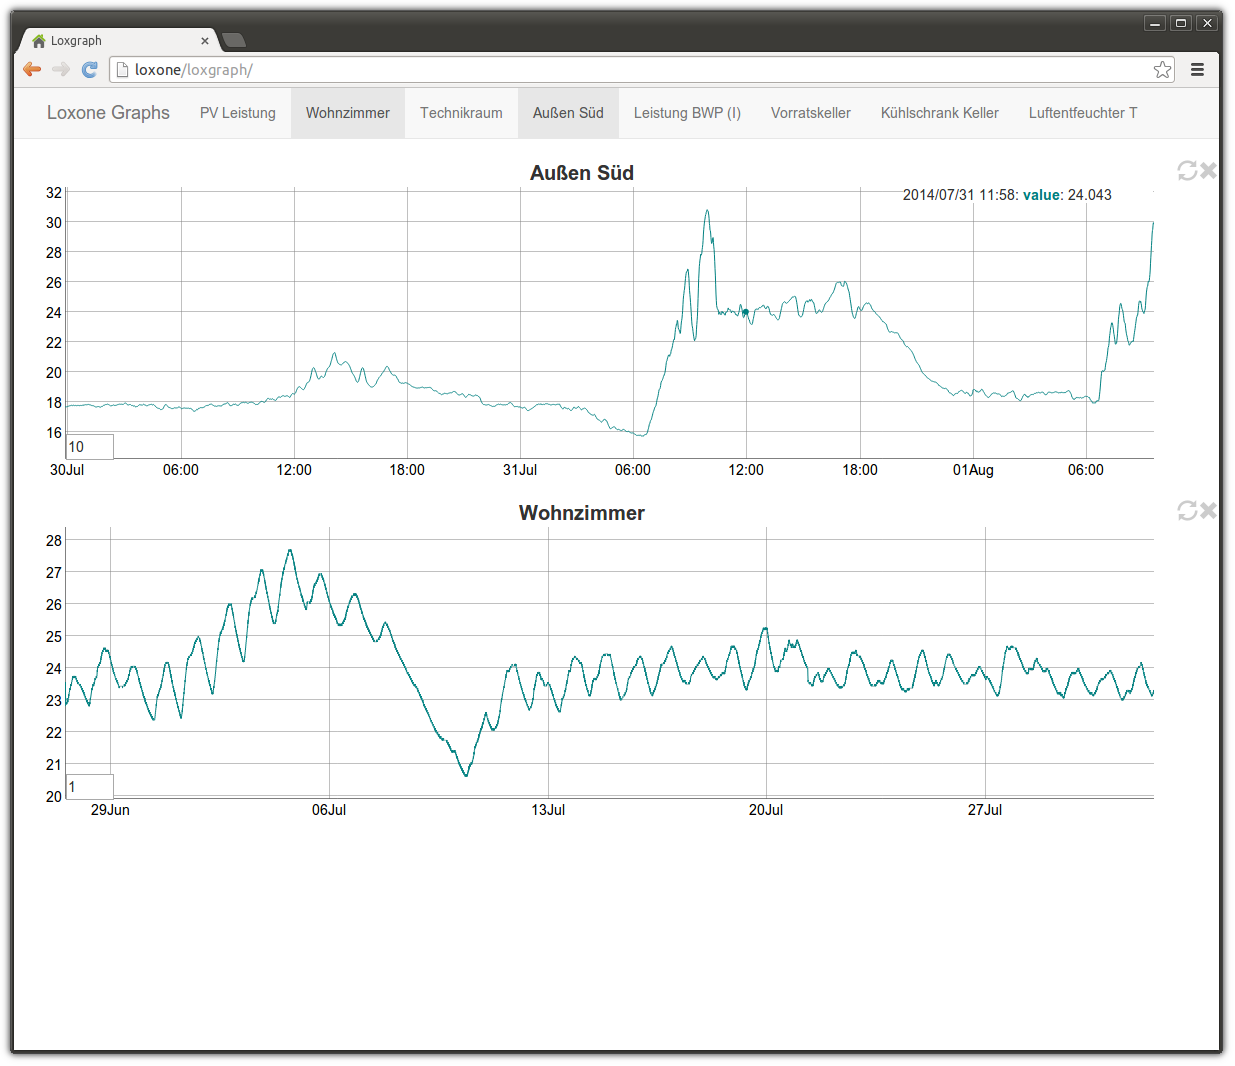
Loxgraph is a solution to display graphs for statistics on a Loxone Miniserver. No separate computer/server/RasPi or internet connection is needed. Loxgraph is basically a JavaScript/HTML single-page application that gets served directly from the web server built into the Loxone Miniserver.
Loxgraph Demo with Sample Data
- Download Loxgraph and unzip the
appfolder - FTP: Connect to your Miniserver
- FTP: Create the directory
/user/common/loxgraph - FTP: Copy the contents of the
appfolder from step 1 into/user/common/loxgraph/
- Open the Web Interface of your Loxone and append
/loxgraphto the URL - Log in with your Loxone credentials
To zoom a graph, select an horizontal or vertical area. Double-click to reset zoom.
To pan, hold shift and drag with the mouse.
To smoothen a graph (e.g. temperature), play with the value in the lower left corner of each graph.
To fetch fresh data, use the reload button for that graph.
TODO describe how to set up dev. env, code style etc
- chat: #loxone on Freenode IRC
- email: to protect from spammers, it's behind a reCAPTCHA
- open an Issue
