Welcome to Altruistiq! Thank you very much for being here. 🙏
For this assessment we will be using 4 things:
- The code in the repo
- Your laptop to run the code
- Your IDE which you will screenshare
- (optional) https://webwhiteboard.com/ for architecturing & brainstorming
This repo will help you kick-start your live coding session. The following has been set up (check package.json for full details) but you're free to use any package you may seem fit:
- express
- mocha
- babel
- axios
- lodash
- vue
- vuex
Hot reloading is enabled (backend) and tests rerun when code changes.
Clone this repo, then
cd backend && npm i
cd fronted && npm i
Then in footprintApi.js add the API key that's been given to you on line 8
Code automatically reloads upon code changes. You will need to refresh your browser if you use it.
cd backend && npm start
cd frontend && npm start
To run test (code and tests are being watched so automatically reruns).
npm test
Please read through all the tasks to understand the full scope of this assessment.
Create an api endpoint at /chart-data.
To get the data for this API, you will use the footprint api which has already
been setup for you. Use as follows:
import footprintApi from "./footprintApi";

// get all countries and their countryCodes
await footprintApi.getCountries();

// this will give you carbon data per year for that country
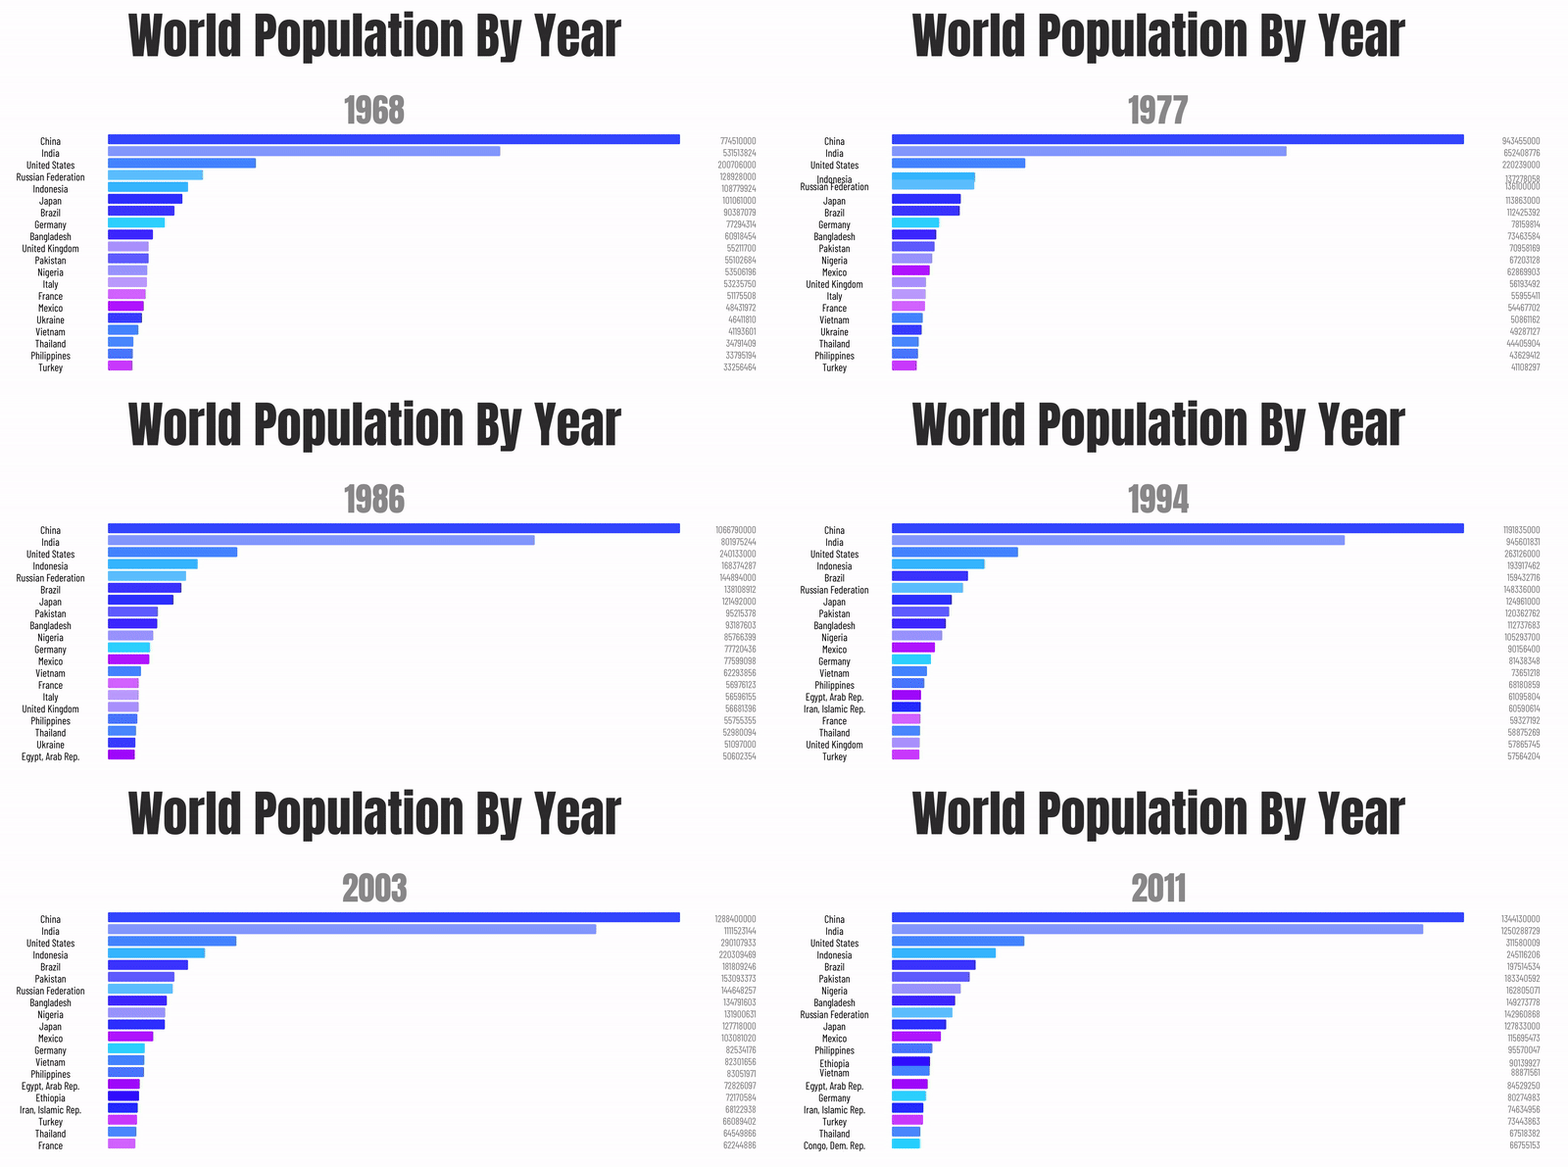
await footprintApi.getDataForCountry(countryCode);Create an animated chart as per this example, but style it as per the Figma design
Fetch this Figma file to get started.
The font used is
@import url('https://fonts.googleapis.com/css2?family=Inter:wght@300;400;500;600&display=swap')
Cache on front and backend.
Secure the API endpoints however you see fit.
Make your API response under 1 second. Keep in mind that your API can be triggered multiple times per second.
