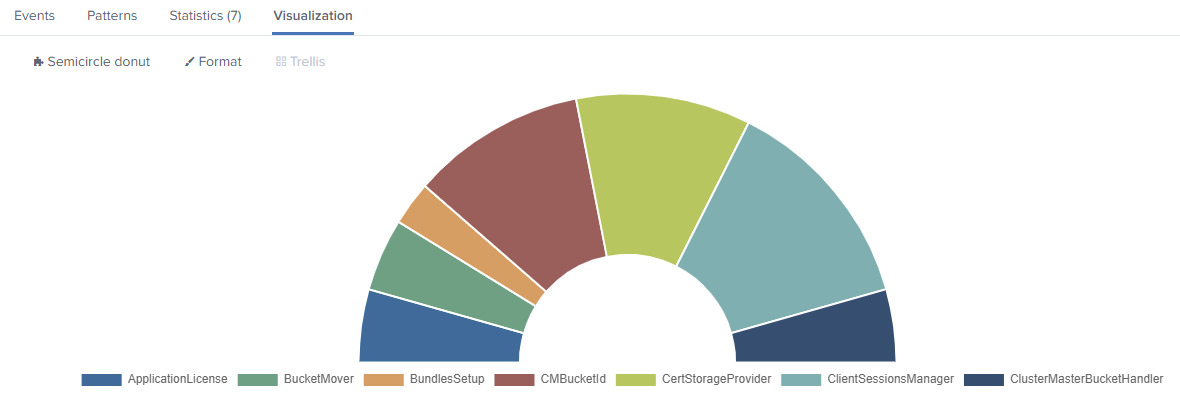
A simple donut/pie chart that can be displayed as a semicircle and supports multiple series on a single chart.
It is built with the chart.js library. Colours can be explicitly set in the search query. Supports dark mode.
If you hated pie charts, then you are really going to hate multi-series pie charts...
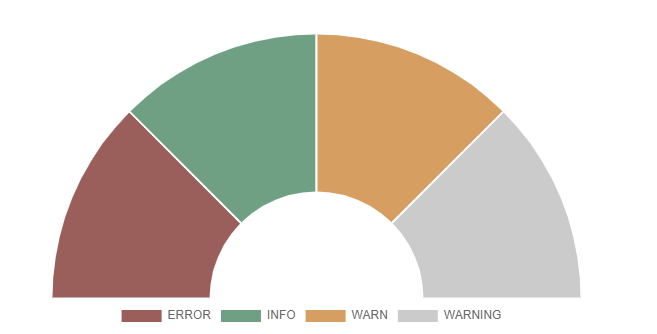
index=_internal |stats count by log_level
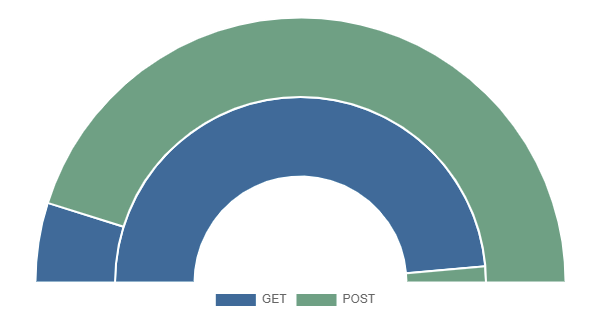
index=_internal sourcetype=splunkd_ui_access| stats avg(spent) as spend avg(bytes) as bytes by method
index=_internal | eval len = len(_raw) |stats count by log_level | eval color = case(log_level=="ERROR", "#af575a", log_level=="WARN", "#ed995f", log_level=="INFO", "#4fa484", true(), "#cccccc")
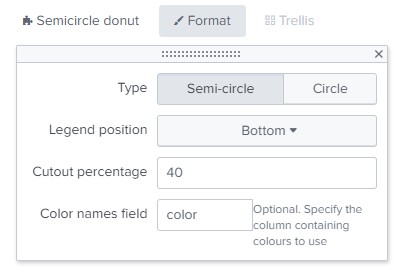
You then need to go into the "Format" options and type the field name "color".
The following third-party libraries are used by this app. Thank you!
- Chart.js - MIT - https://www.chartjs.org/
- jQuery - MIT - https://jquery.com/
- Font Awesome - CC BY 4.0 License - https://fontawesome.com/