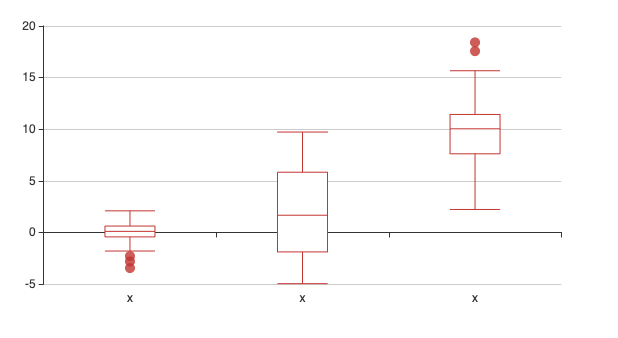
Boxplot with groups showing name of column instead of group #231
Comments
|
Yes, that was fixed here #219 (comment) Make sure you're on the latest version |
|
@JohnCoene - for some weird reason, no joy. |

|
Can you restart your R session after the install and try again please? |
|
@JohnCoene thank you... that worked!! What exactly happened there? |
|
You downloaded and installed a new version of echarts4r, but you still had the previous version loaded in your workspace. |
|
Yes indeed. |
# for free
to join this conversation on GitHub.
Already have an account?
# to comment
df <- data.frame(
x = c(
rnorm(100),
runif(100, -5, 10),
rnorm(100, 10, 3)
),
grp = c(
rep(LETTERS[1], 100),
rep(LETTERS[2], 100),
rep(LETTERS[3], 100)
)
)
df %>%
group_by(grp) %>%
e_charts() %>%
e_boxplot(x)
This example from your page creates three boxplots title 'x' on the x-axis rather than name of groups. please fix.
The text was updated successfully, but these errors were encountered: