Using group_by to one-line plot multiple boxplots does not set the x axis labels correctly #219
Comments
|
@lianos I have check the source code, and the labels of x-axis may not be set properly when using Documents are here: https://echarts.apache.org/en/option.html#xAxis.data library(dplyr)
library(echarts4r)
dfl <- data.frame(
  var = rep(c("x", "y"), each = nrow(df)),
  value = c(df$x, df$y))

dfl %>%
  group_by(var) %>%
  e_charts() %>%
e_boxplot(value) %>%
e_x_axis(data = c("x", "y")) |
|
I see, thanks for digging around in the codebase! For now, I'd be too nervous to use that approach as I fear I'd be mislabeling the order of the x-axis. I'm not all that familiar with the codebase just yet, but it seems you chased the code logic down to the Poking around, here's a naive way for a quick fix to the codebase that looks to be working on my side, if we replace the if (length(e$x$data) > 1 && serie == name) {
nm <- .name_it(e, serie, names(e$x$data)[i], i)
} else {
nm <- .name_it(e, serie, name, i)
}Now my original snippet labels the x axes correctly: dfl %>%
group_by(var) %>%
e_charts() %>%
e_boxplot(value)However probably won't be so simple when it's done "professionally" :-) Just having some fun, [note I edited this comment because my first shot at this I posted was very wrong] |
|
Thanks, there is definitely an issue here somewhere, I'll take a look. |
|
Pushed a fix, hope this works. df <- data.frame(
x = c(
rnorm(100),
runif(100, -5, 10),
rnorm(100, 10, 3)
),
grp = c(
rep(LETTERS[1], 100),
rep(LETTERS[2], 100),
rep(LETTERS[3], 100)
)
)
df %>%
group_by(grp) %>%
e_charts() %>%
e_boxplot(x) |
|
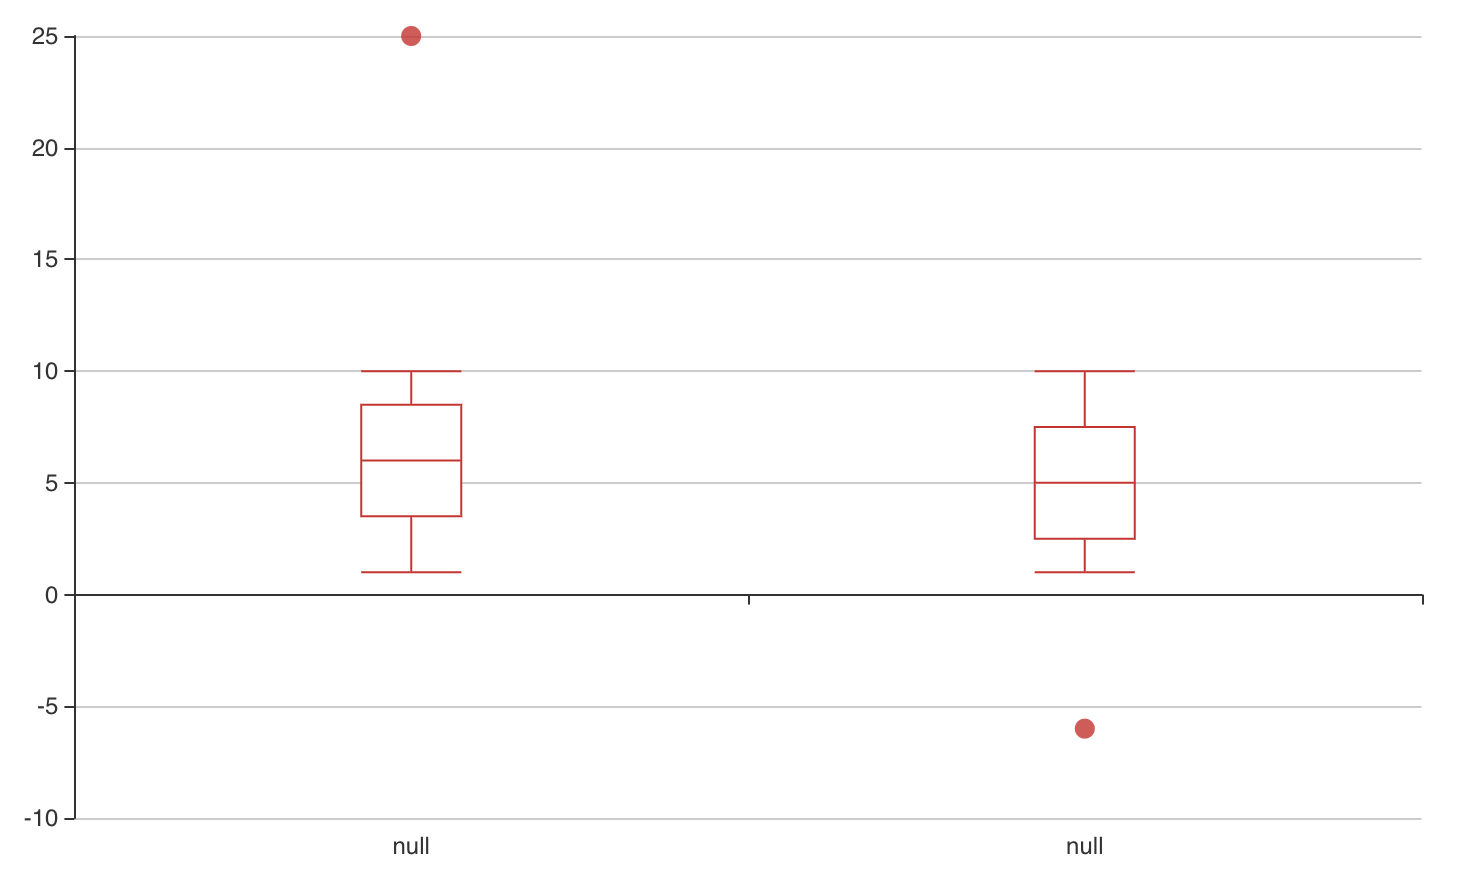
Hi John, Thanks for taking a look. This does indeed fix the For instance: df <- data.frame(
x = c(1:10, 25),
y = c(1:10, -6))
df %>%
e_charts() %>%
e_boxplot(x, outliers = TRUE) %>%
e_boxplot(y, outliers = TRUE)Gets you this:
|
|
Thanks for spotting this, just fixed! |
First: thank you for the package, I've only just encountered it, but it looks like it has a lot of promise.
It seems like in order to draw multiple box plots on the x-axis w/ out writing
e_boxplot(...)for every value over x, we need to usegroup_by()So, taking the example from the
e_boxplot()man page which has data in a wide format, we have:If we had multiple categories we wanted to create boxplots for across the x-axis, that can get tedious, so it seems we need to rather convert the data into a long format, and use group_by, like so:
Perhaps there is a way to use the
nameparameter in thee_boxplot()to address this, but not quite sure how if so.Thanks!
The text was updated successfully, but these errors were encountered: