My objective here is to share some of the code, models, and data from the OpenBCI 16-channel headset. I suspect many people are not going to be able to get their hands on the headset, but that doesn't mean you can't still play with some of the data!
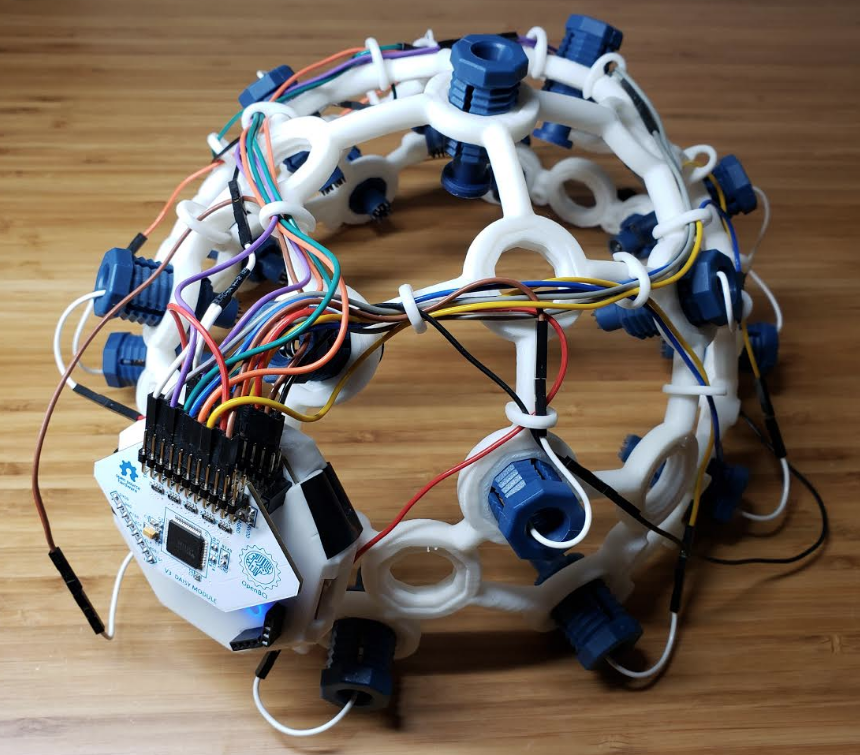
Headset used is the OpenBCI Ultracortex Mark IV. You can check out OpenBCI's products here: https://shop.openbci.com/
To start, my objective is to train a neural network to detect thoughts of left/right movements. From here, I would like to apply this BCI control to GTA V
training.py - This is merely an example of training a model with this data. I have yet to find any truly great model, though at the end of this readme, I will try to keep an updated confusion matrix of my best-yet models. This way, you can easily tell if you've been able to find something better than what I've got.
If people are able to beat my model and are willing to share their models. I will post some sort of highscores somewhere on this repo.
Since some people wont be able to resist making a model on validation data...I will use my own separate validation data to actually create scores. If you're not cheating, this shouldn't impact you ;)
analysis.py - You can use this to run through validation data to see confusion matricies for your models on out of sample data.
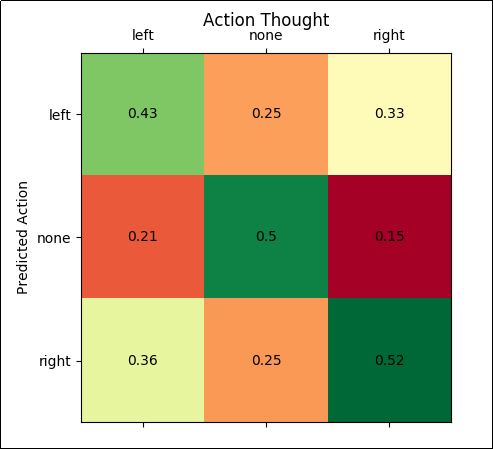
Example of a % accuracy confusion matrix (the default graphed):
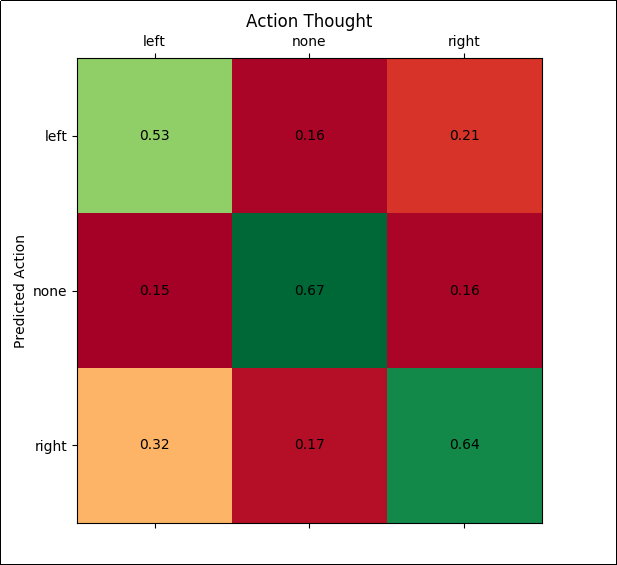
In the above confusion matrix, we can see that if the thought is left, the model accurately predicts this 53% of the time, predicts that left thought is actually none 15% of the time, and predicts right 32% of the time.
For the "right" thought, we can see the model predicted that correctly 64% of the time, predicted none 16% of the time, and predicted left 21% of the time.
An "ideal" confusion matrix would be a perfectly green diagonal line of boxes from the top left to the bottom right. This isn't too bad so far.
testing_and_making_data.py - This is just here if you happen to have your own OpenBCI headset and want to actually play with the model and/or build on the dataset. Or if you just want to help audit/improve my code. This file will load in whatever model you wish to use, you will specify the action you intend to think ahead of time for the ACTION var, then you run the script. The environment will pop up and collect all of your FFT data, storing them to a numpy file in the dir named whatever you said the ACTION thought was.
Numpy TensorFlow 2.0. (you need 2.0 if you intend to load the models) pylsl (if you intend to run on an actual headset) OpenBCI GUI (using the networking tab https://docs.openbci.com/docs/06Software/01-OpenBCISoftware/GUIDocs)
Currently, the data available is 16-channel FFT 0-60Hz, sampled at a rate of about 25/second. Data is contained in directories labeled as left, right, or none. These directories contain numpy arrays of this FFT data collected where I was thinking of moving a square on the screen in this directions.
I am not sure where I want to put the data, but, for now, it's available here: Download: https://hkinsley.com/static/downloads/bci/model_data_v2.7z
I plan to upload more and more as I create more data.
File structure (for both the data and validation_data directories):
- data
- left
- none
- right
- validation_data
- left
- none
- right
Contained within the left, none, and right directories are .npy files with unix timestamps as their name. Each of the files is a numpy array of shape:
import numpy as np

d = np.load("data/left/1572814991.npy")
print(d.shape)

>>>(250, 16, 60)
Each file is targeted to be 10 seconds long, which, at 25 iter/sec gives us, the 250 (though you should not depend/assume all files will be exactly 250 long). Then you have the number of channels (16), and then 60 values, for up to 60Hz. For example, if you do:
import numpy as np
import matplotlib.pyplot as plt

d = np.load("data/left/1572814991.npy")

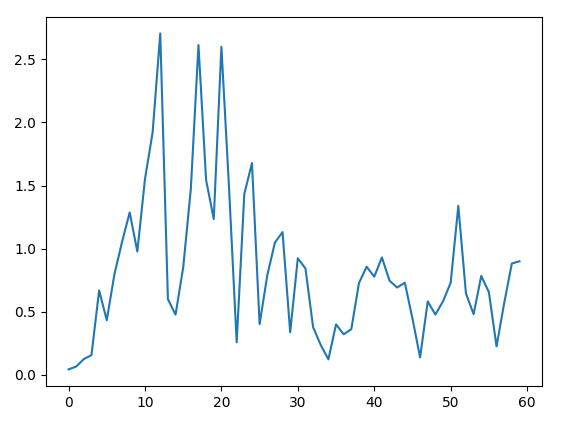
plt.plot(d[0][0])
plt.show()
You will see a graph of: The data for Channel 0 for the very first sample.
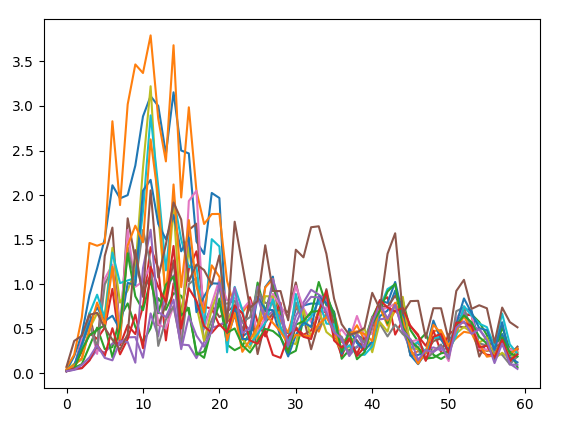
If you want to see all 16 channels:
import numpy as np
import matplotlib.pyplot as plt

d = np.load("data/left/1572814991.npy")

for channel in d[175]:
    plt.plot(channel)
plt.show()More info: https://github.com/Sentdex/BCI/tree/master/models#all-cnn-model-6323-acc-loss-252model
