-
Notifications
You must be signed in to change notification settings - Fork 4
Usecase: Tree visualization with InTreeGreat

-
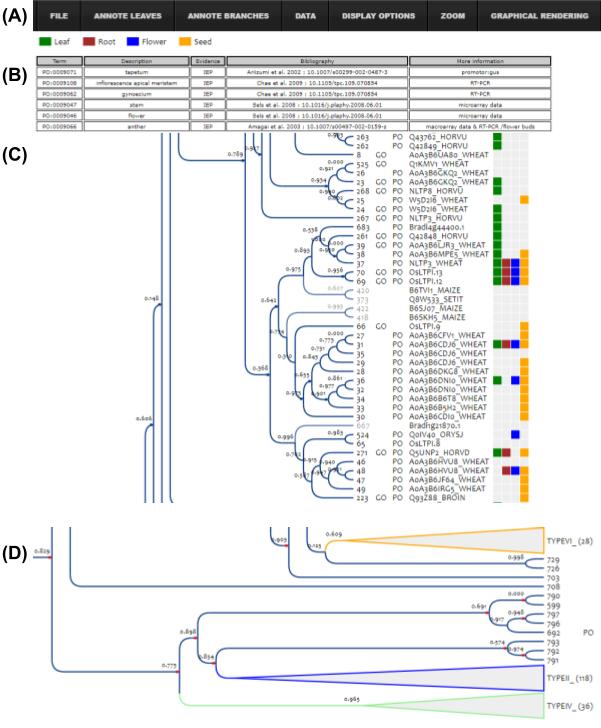
First of all, go to this visualizator: https://phylogeny.southgreen.fr/treedisplay/index.php?data=msdmind , then follow the next steps in order to reproduce the visualization of this figure.
-
Open the « Display options » menu and choose « ultrametric » in order align leaves.
-
Open the « Data » menu and activate the « Polypeptide name » option. These are more informative: the last five letters indicate the species of each protein (see Uniprot species code).
-
Open the « Annote branches » menu, and i) « annote all types » to collapse tree parts containing proteins that are annotated by types ; ii) choose the « color » option and iii) click on « annote all types » again in order to color the collapsed parts with colors corresponding to types. You are now in the « D » part of the figure: the compact view.
-
Open the « Annote leaves » menu, and in the first section of the menu, choose « Word: Leaf ; Color: Green » then validate. Then « Word: Root ; Color: Brown », « Word: Flower ; Color: Blue » and « Word: Seed ; Color: Orange ».
-
Finally, open the « Annote branches » menu and select « Collapse » option. Now, you are able to collapse / uncollapse any part of the tree, and dragging the mouse on the top of « GO / PO » you can display the full annotations of each protein. The colored squares allow you to observe correlations between the annotations and the structure of the tree.
Please don't hesistate to contact the webmaster.