This package creates a simple user interface for creating subfigures when working with matplotlib.
import matplotlib.pyplot as plt
plt.figure(figsize=(10,10))

from matplotlib_dashboard import MatplotlibDashboard
dashboard = MatplotlibDashboard([
    ['top' ,'top' ,'top' ,'top'  ],
    ['left','left', None ,'right'],
    ['left','left','down','right'],
], as3D=['left'], wspace=0.5, hspace=0.5)

import numpy as np
dashboard['top'].plot(np.random.rand(200), color='red')
dashboard['top'].set_ylabel('y')
dashboard['top'].set_xlabel('x')
dashboard['top'].set_title('top plot')

dashboard['right'].bar(['A','B','C'], [10,35,17], color='blue')
dashboard['right'].set_ylabel('freq')
dashboard['right'].set_xlabel('label')
dashboard['right'].set_title('right bar')

from PIL import Image
dashboard['down'].imshow(Image.open('./test1.jpeg'))
dashboard['down'].get_xaxis().set_ticks([])
dashboard['down'].get_yaxis().set_ticks([])
dashboard['down'].set_title('down image')

z = ((5-np.arange(100)%10)**3).reshape(10,10)
x, y = np.meshgrid(np.arange(z.shape[0]), np.arange(z.shape[1]))
dashboard['left'].plot_surface(x, y, z, color='green')
dashboard['left'].set_ylabel('x')
dashboard['left'].set_xlabel('y')
dashboard['left'].set_zlabel('z')
dashboard['left'].set_title('left surface')

plt.show()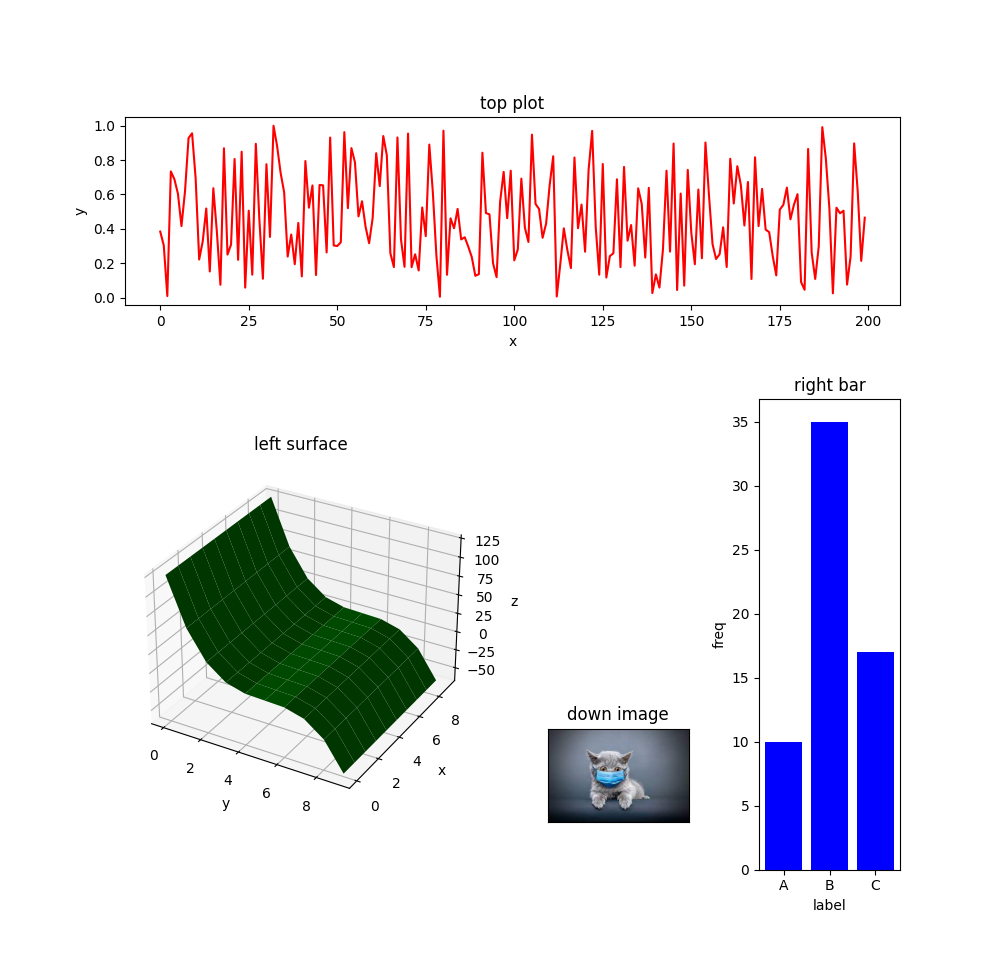
- Pass the map of subfigures you want when getting an instance of the dashboard. Write the map as a list of lists or a 2D array.
- Get the subfigure you want using get-item syntax. The name is what you defined in the map.
- Use the
Nonekeyword to access the empty part of the map. - Use
as3Dargument to determine which subfigures are 3D. - Any customization on
matplotlib.pyplotalso applies to this dashboard. For example, useplt.figure(figsize=(x,y))to change the size of the dashboard figure. - This module is based on
matplotlib.gridspec. Therefore, you can use thegridspecinitialization configurable parameters with the same functionality in this dashboard initialization. For example, set thewspaceandhspaceparameters to change the horizontal or vertical spacing between subfigures.
pip install matplotlib-dashboard