For --history key add possibility to view html chart with PriceGenerator package
#6
Comments
…erAPI-UniLogger"`. Also, `PriceGenerator` library was added
|
When launched with the Also, you can build charts for previously saved csv-files with the candles history. To do this, you need to specify the Test build: https://app.travis-ci.com/github/Tim55667757/TKSBrokerAPI/builds/256801023 |
|
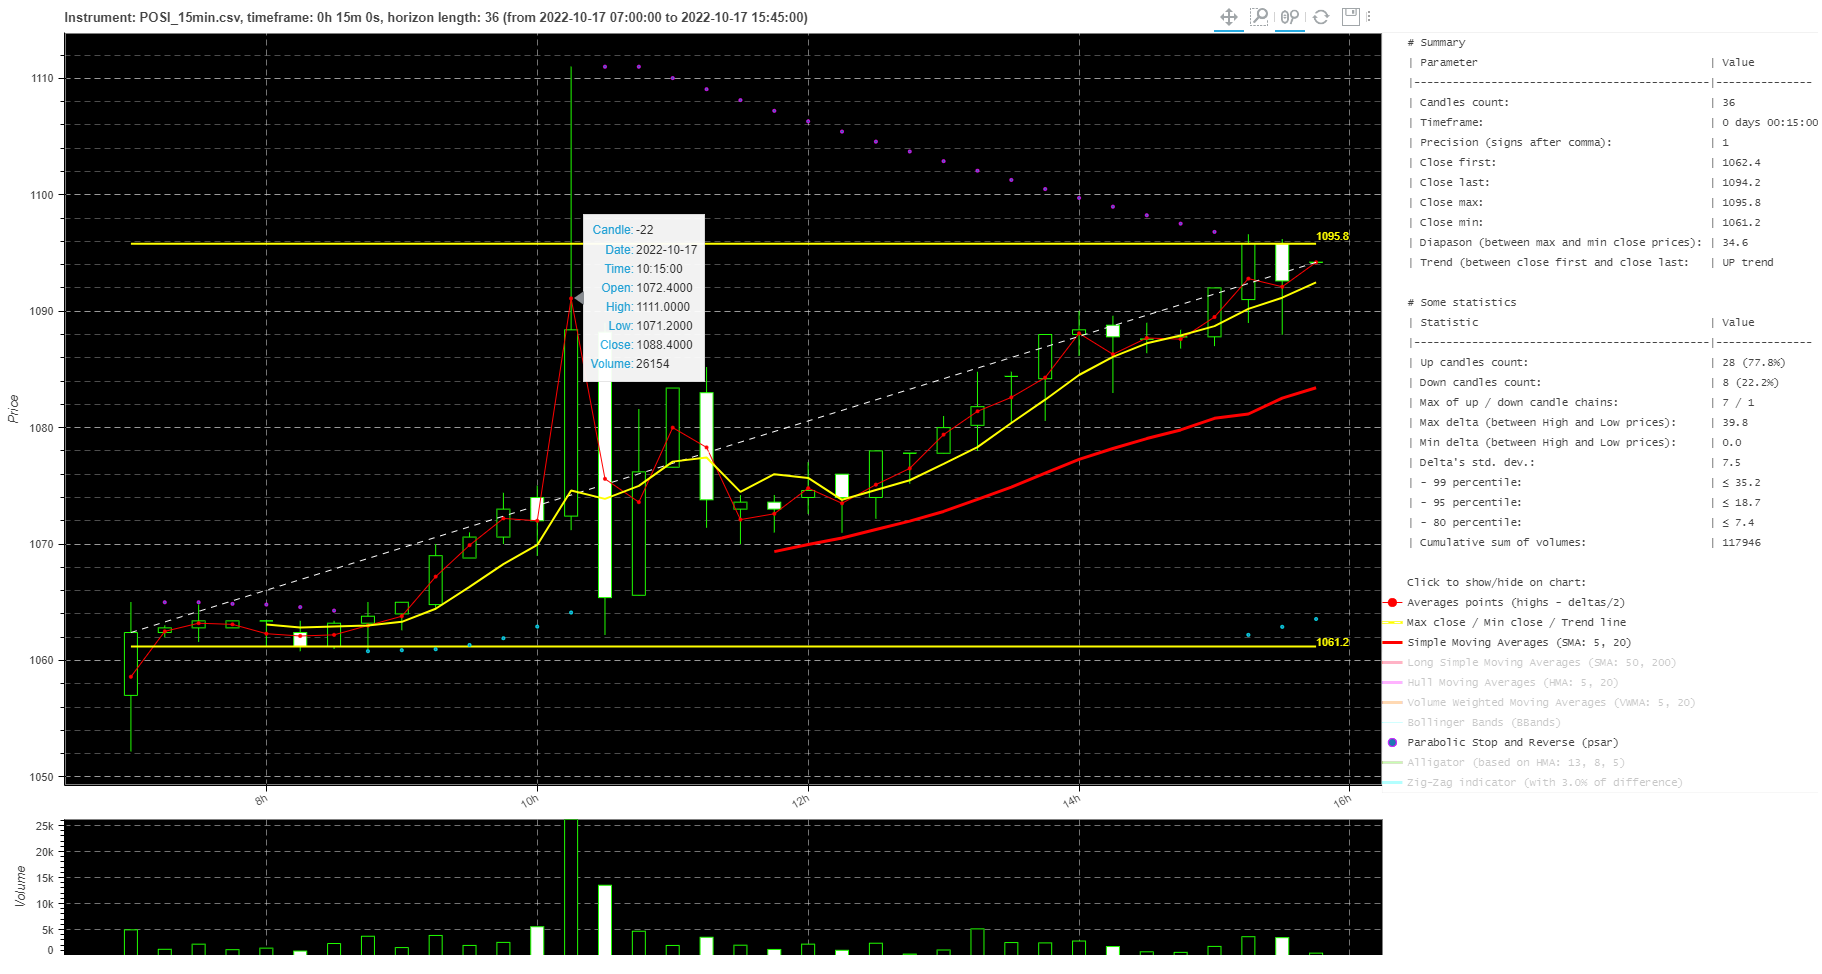
The generated graphs of various types will look like below. By default, they are saved to the
Real examplesThe first example of uploaded data can be found in the file ./docs/media/GAZP_hour.csv, and the generated chart in the file ./docs/media/index_GAZP_google_chart.html.
The second example of uploaded data can be found in the file ./docs/media/POSI_15min.csv, and the generated chart in the file ./docs/media/index_POSI_bokeh_chart.html.
|


Add key
--render-chartwith two possible parameter:interact(i) ornon-interact(ni).If you select
interactthen chain of candlesticks will render as interactive Bokeh chart. See examples: https://github.com/Tim55667757/PriceGenerator#overriding-parametersIf you select
non-interactthen chain of candlesticks will render as not interactive Google Candlestick chart. See examples:https://github.com/Tim55667757/PriceGenerator#statistics-and-chart-on-a-simple-template
The text was updated successfully, but these errors were encountered: