-
Notifications
You must be signed in to change notification settings - Fork 9
Developer's guide
The modular and scriptable nature of TreeViewer makes it particularly suitable for users who are comfortable with writing code. Custom scripts can be used to add all sorts of elements to TreeViewer plots, without tying users to the developers' expectations of how they should use the program.
Just like TreeViewer itself, custom scripts and modules for the program are developed using the C# programming language. You can find a series of videos describing C# here.
When creating plots, TreeViewer compiles and executes the code for custom scripts on the fly, which opens great avenues for customisation, as users can modify the actual source code that is executed, and not only the parameters for some fixed functions that have been defined by the developers.
Of course, with great power comes great responsibility: as every tree file with TreeViewer module information is essentially a small program, care should be taken not to open files coming from untrusted sources, which may contain malicious code. However, the code-signing features of the program make it possible to "trust" individual authors and detect whether a file has been altered.
There are three main ways in which custom code can be executed in TreeViewer: using a custom formatter, using a custom script and creating a new module.
Custom formatters are pieces of code that are usually small and are used to format attribute values for display. Formatter windows generate default formatter code based on parameter that can be set in the interface, but this code can be altered to fine-tune the behaviour of the formatter. An example of this would be to alter the code for a string formatter so that a label shows values from 0% to 100% rather than from 0.0 to 1.0.
Custom scripts can be implemented by adding a Custom script module to the plot (either as a Further transformation, or as a Plot action). They can be used to perform one-off alterations of the tree (maybe to fix a mistake in the tree file) or to add custom elements to the plot (e.g. a comment). If the custom script performs an action that may be useful for multiple analyses, it might be a good idea to implement it as a module and submit it so that it can be included in the repository and used by other people.
Creating a new module makes it possible to reuse the same code with multiple tree files in a "native" way - i.e. the custom module can be added to the plot just like any of the default modules. It is also possible to submit the module to have it included in the module repository; this will allow other people to use it with their trees. One thing to note is that if you create a tree file with a custom module, all the computers where the file is to be opened will need to have the module installed; this is not the case for custom scripts, because in that case the tree file will carry all the necessary source code.
Regardless of whether code is being entered for a custom formatter, custom script, or a module, TreeViewer uses the same interface, which leverages the CSharpEditor control to provide a light-weight Visual Studio-like experience, featuring syntax highlighting, intelligent code completion, inline documentation, real-time error checking, breakpoints and more.
The code completion suggestion window opens automatically when appropriate as code is being typed in the control, and makes it easy to write code without having to remember the exact names of classes and methods. Hovering the mouse above a code item opens a popup window with a description of the item.
The bar at the bottom of the code editor contains various controls:
- A drop-down list used to change the font size.
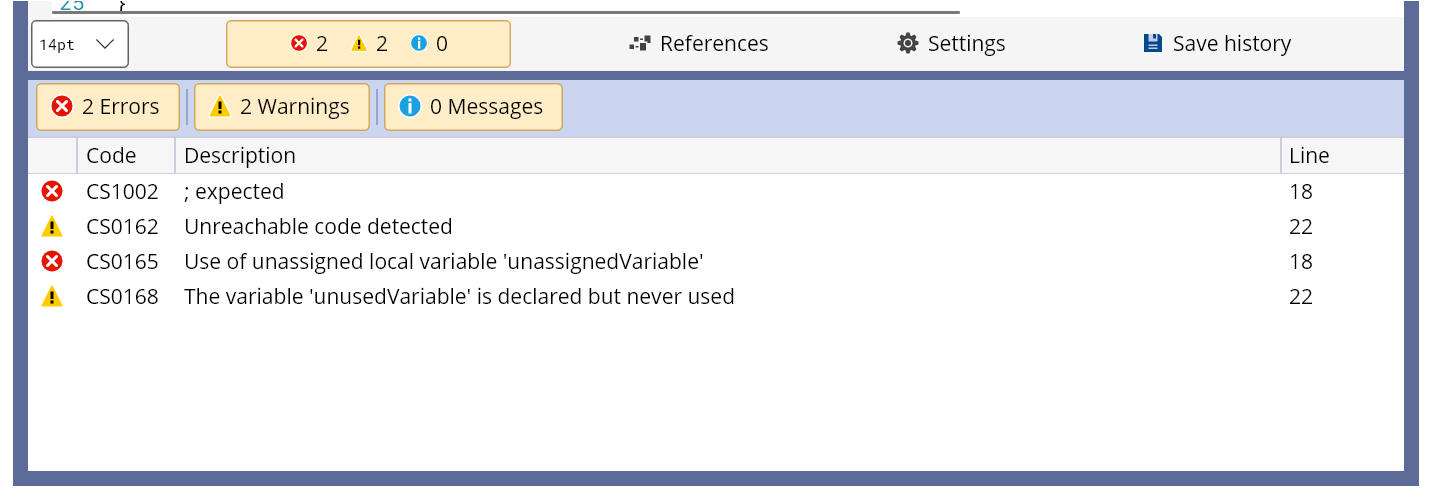
- A button showing the number of errors and warnings. Clicking on this button opens a panel detailing those errors and warnings.
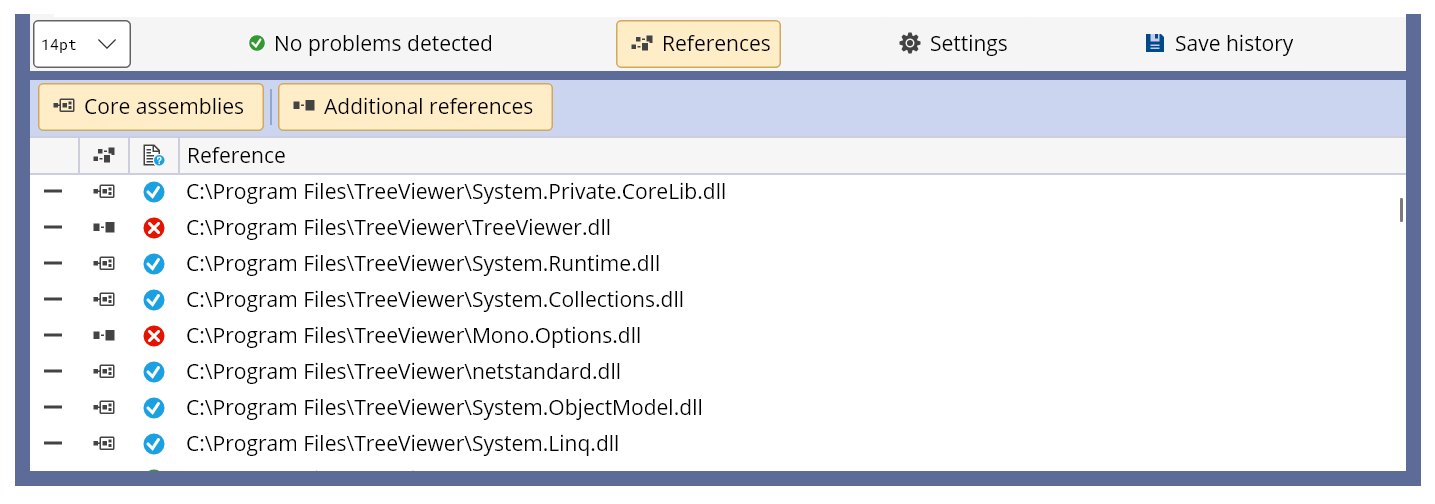
- A button that opens the list of libraries referenced by the source code.
- A button that opens a panel that can be used to change settings for the code editor. When these settings are saved, they apply to all code editors in the program and persist even after TreeViewer is closed.
- A button that opens a panel with the save history of the file.

The error panel shows a list of all the errors and warnings that were generated by the code. Clicking on an error or a warning positions the cursor at the position in the code where it was generated.

The References panel contains a list of all the libraries used by the source code. For each library, a tick mark (✓) or a cross (✗) show whether inline documentation is available for that libary. Individual library references can be added or removed, but this should not be necessary in most cases (it is only useful when writing code that relies on external libraries that are not loaded automatically by TreeViewer).

This panel contains settings that affect the behaviour of all code editor instances in the program. Hovering the mouse on the blue i that is next to each setting shows a description of what the setting does. The Save settings button saves the current settings so that they are applied to all new code editor windows. The Load settings button discards all changes to the settings and loads the last saved settings.
The panel also includes a list of all the keyboard shortcuts that can be used within the code editor interface.

The Save history panel shows a list of all the times that the code has been saved, including both autosaves and manual saves. Each save file can be restored or deleted. The saved code elements can also be retrieved using the Load autosaves window accessible from the File menu of the main TreeViewer window.
Breakpoints can be added in three ways:
- By creating a line containing only the following comment:
/* Breakpoint */ - By pressing the
F9on the keyboard. - By clicking on the grey area to the left of the line numbers in the code editor interface.
When code execution reaches a breakpoint, a window opens, showing the code and the value of any variables that are local to the scope where the breakpoint was inserted. This makes it possible to debug the code, investigating the value of critical variables and determining where errors occur.

Note that sometimes the window opens below the main TreeViewer window - if you cannot see it and the programs seems to be hanging, check if there is a breakpoint viewer window hiding somewhere.
Clicking on Resume resumes execution of the script. Enabling the Private members toggle shows private members and properties for the inspected objects. Enabling the Ignore further occurrences toggle makes it possible to ignore further hits to the same breakpoint. This is useful e.g. when the breakpoint is within a loop - otherwise, the breakpoint window would open at each iteration.
A breakpoint can only be inserted before a statement. If there is no suitable statement in the place where you would like to insert a breakpoint, a "trick" is to insert a dummy statement (such as int unused = 0;) and then add the breakpoint before that statement. Breakpoints only show the value of variables that are local to the scope where the breakpoint is defined; if however you wish to inspect the value of a variable with a wider scope, a way to do this is to copy the value of the variable in a local variable. For example:
// ...
{
    int widerScopeVariable = 15;

    if (true)
    {
        int localVariable = widerScopeVariable;

        /* Breakpoint */
        int unused = 0;
    }
}
When this breakpoint is hit, the value of localVariable will be shown (but the value of widerScopeVariable will not).
- Home
- Introduction
-
Workload examples
- Drawing a tree highlighting support values
- Displaying character states on a tree
- Displaying BLAST scores
- Working with large trees from the command‐line interface
- Drawing taxon images
- Drawing an alignment with the tree
- Plotting the age distributions in a time‐calibrated tree
- Plotting multiple age distributions
- Plotting the results of a stochastic mapping analysis
- Creating a new tree
- Crop regions and output DPI
- Tree statistics
- Comparing trees
- Command‐line interface
- Developer's guide
- Glossary