- Refer to research report document in repository for detailed study.
- Consolidated data released by World Bank, World Health Organization, and United Nations.
- Augmented dataset with more features from World Development Indicators repository.
- Investigated whether there are any significant relationships between specific factors contributing suicide.
- Created a single-page interactive visualization dashboard using Dash (Plotly) with multi-select features.
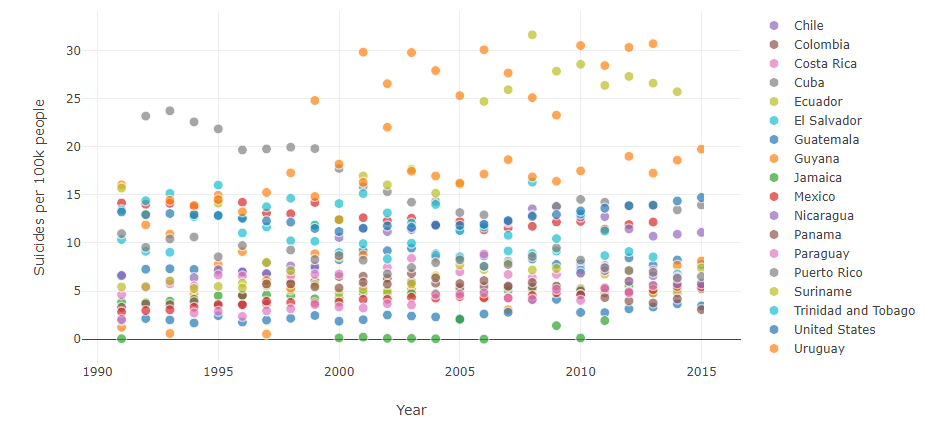
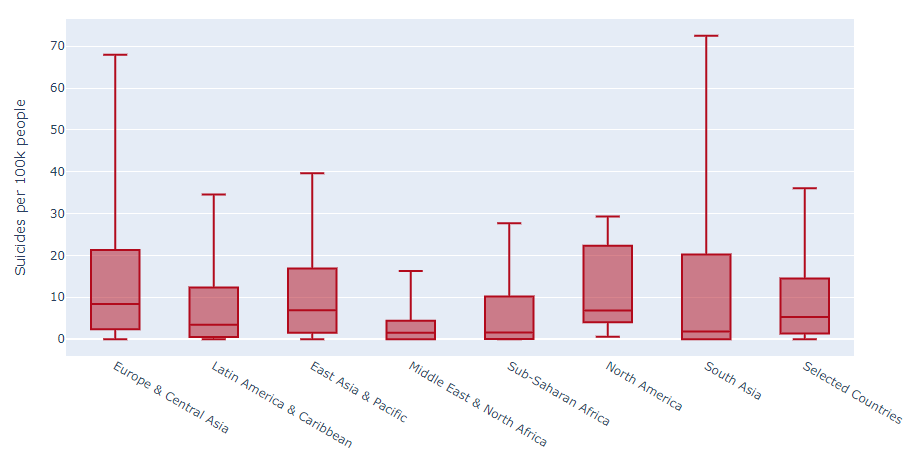
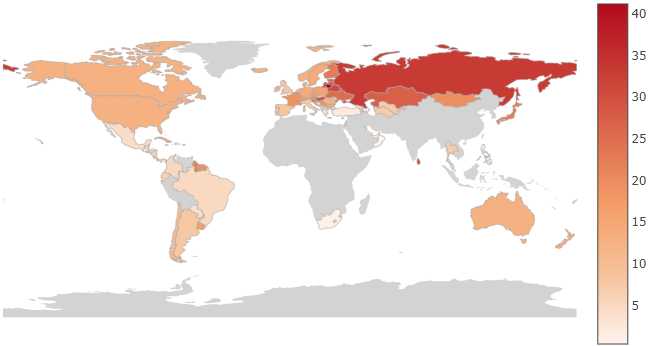
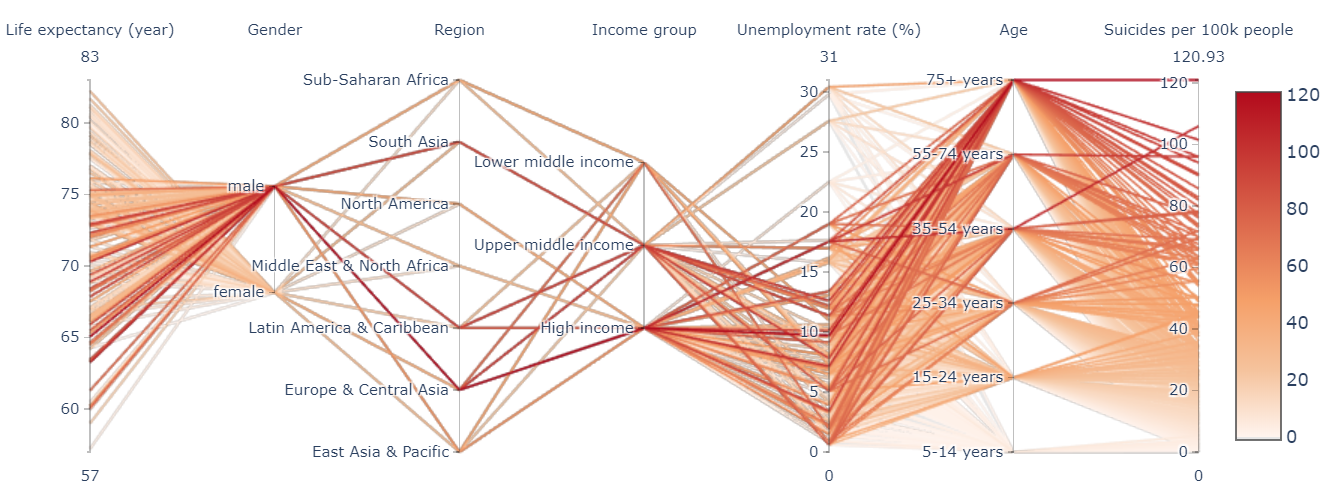
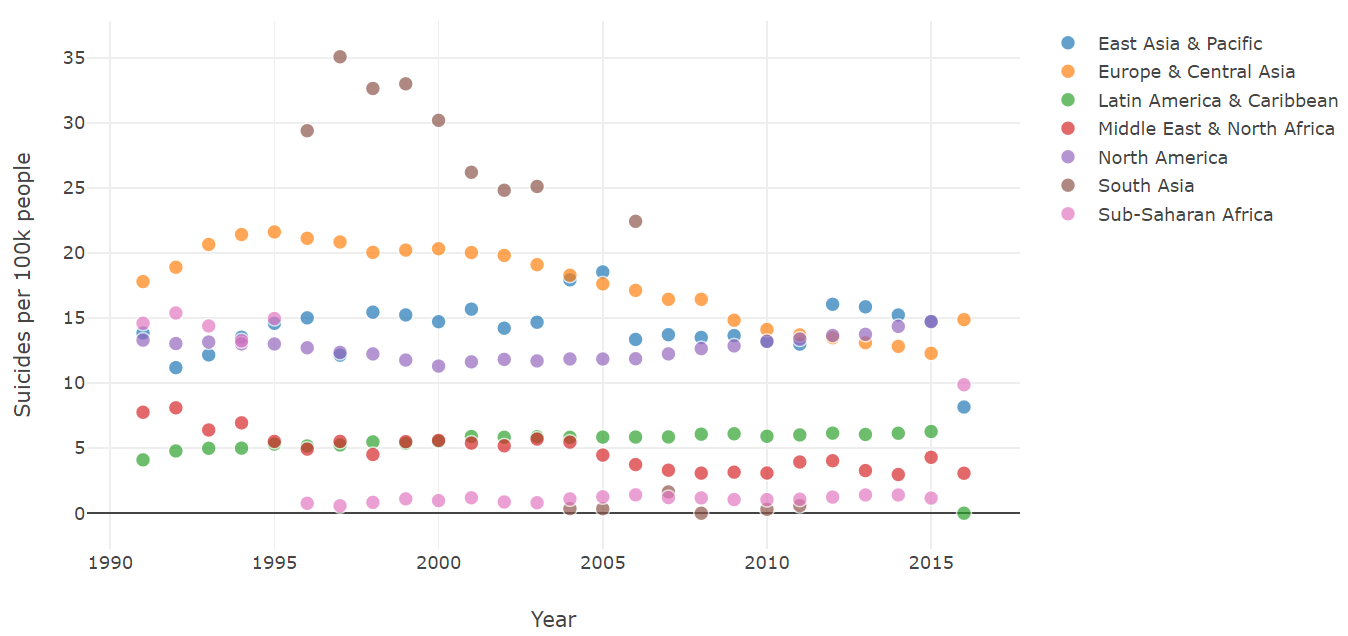
- Dashboard consists of an interactive choropleth map, scatter plot, box-and-whisker plot and parallel coordinate plot.
- All plots are updated simulataneously based on click based selection / interaction on any one plot and/or from adjusting the header options.
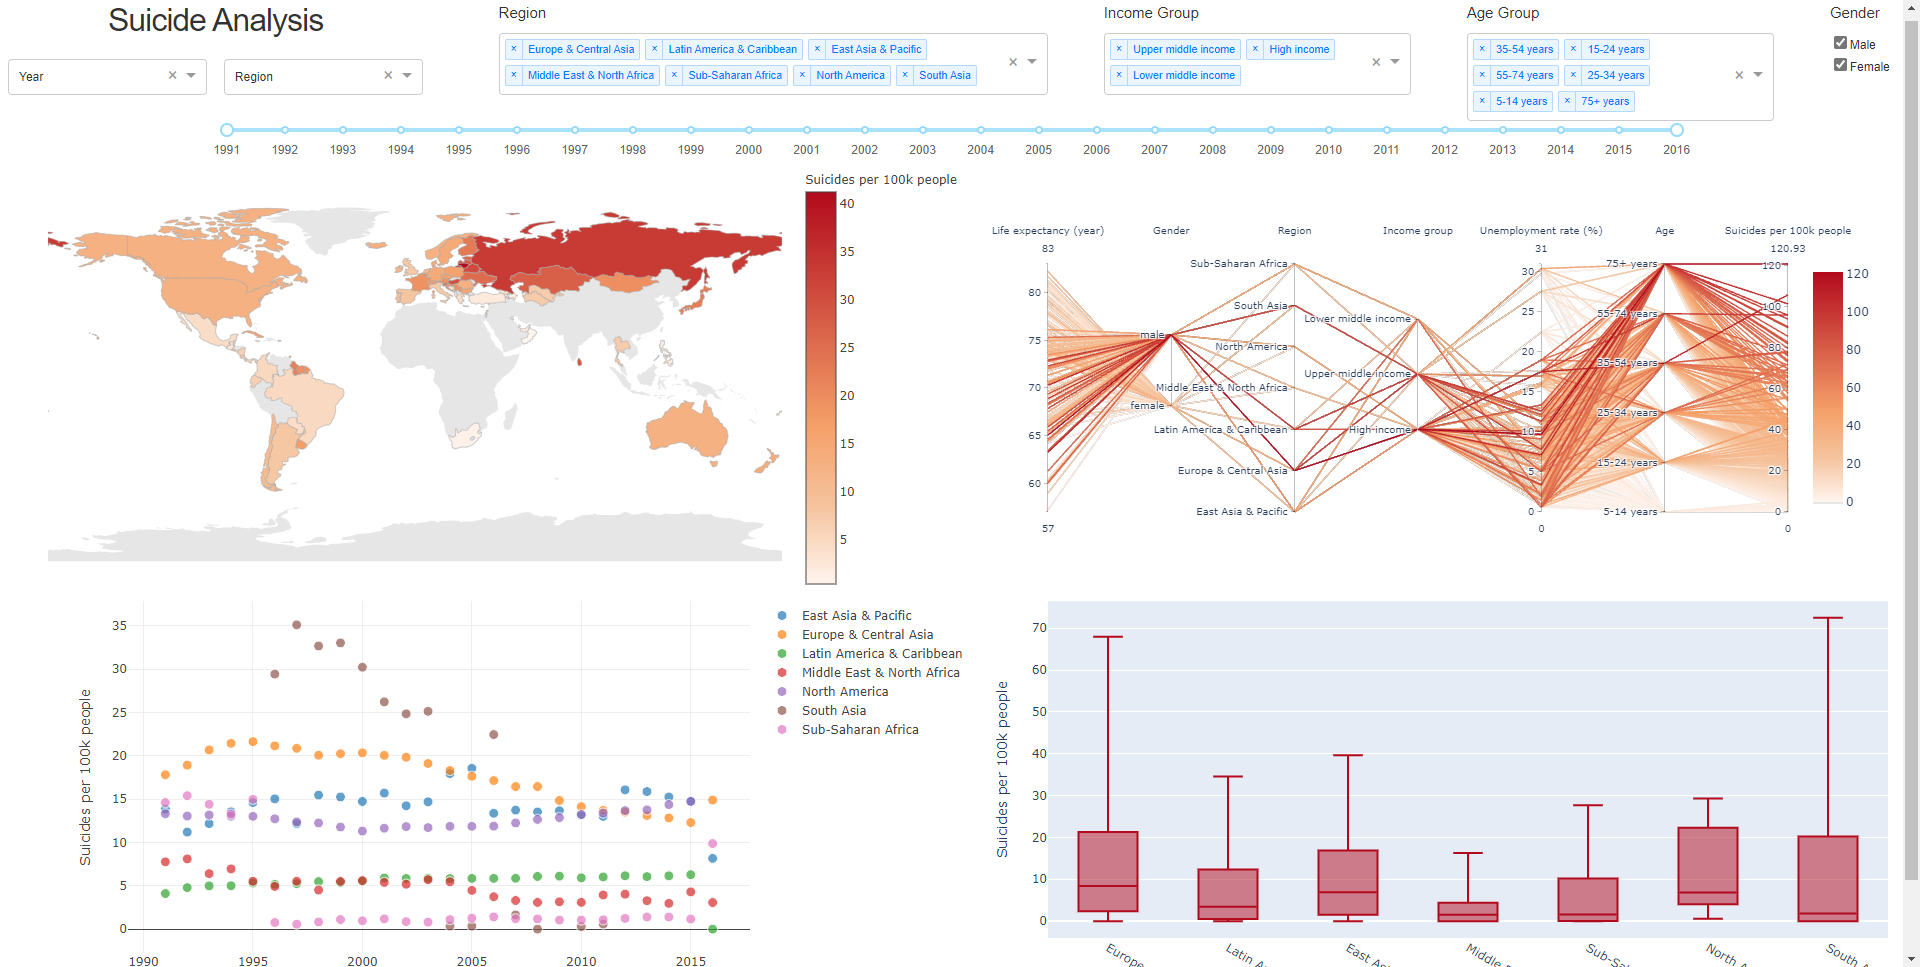
- Dropdowns, multi-selects, checkboxes and yearly timeline.
- For multi-selects, checkboxes and yearly timeline: All options are pre-selected to load the entire data once the dashboard is opened.

- All countries pre-selected at the start.
- Parallel coordinate plot interacts with the world map based on the area selected on the world map.

- Selecting a few countries using box select

- The other 3 visualizations are filtered based on the selected countries: