High pasta and rootlessport CPU load #23686
Comments
|
Thanks for reporting this!
I wouldn't expect |
|
About Scenario 1: I can reproduce something similar, in my case downloading from the The good news is that with higher transfer rates I get, on the same system, approximately 14gbps at 100% CPU thread load, and if I CPU-starve pasta with the test file download, I get approximately the same transfer rates. That is, if we have bigger chunks of data to transfer (because we have less CPU time), the CPU load doesn't increase linearly, so I don't see a practical issue with it. Anyway, this is what says about it:
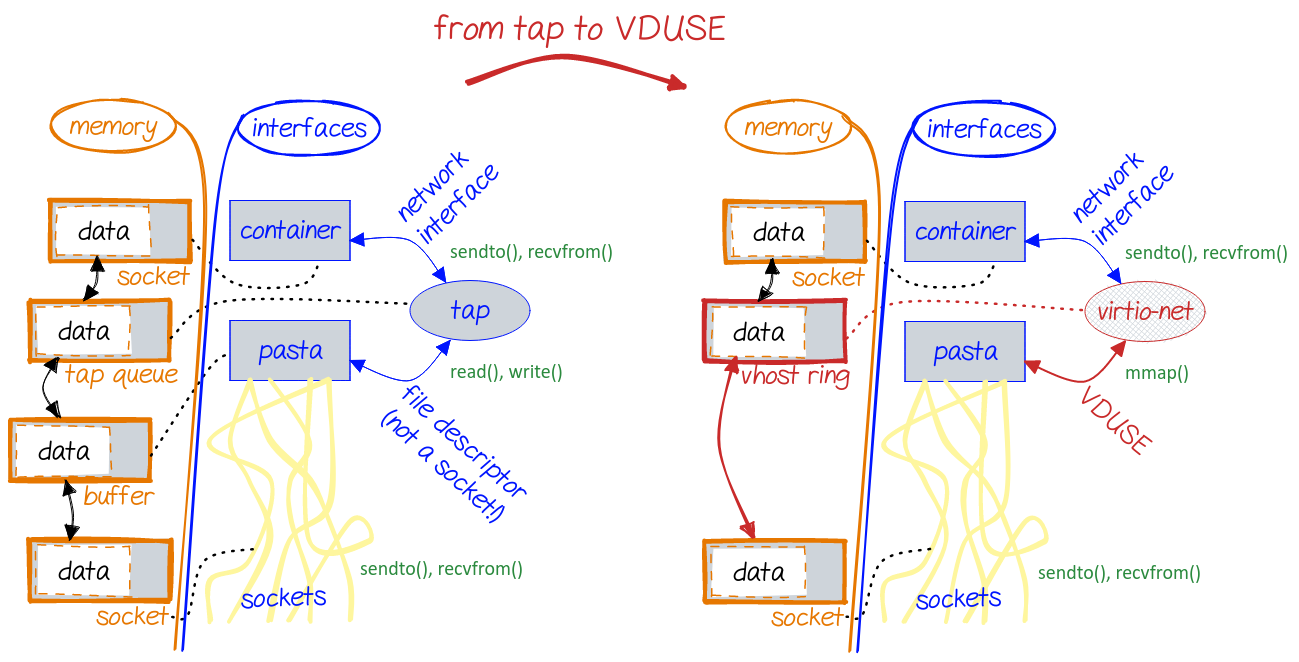
There isn't much we can do about that, except for a planned VDUSE ¹ ² back-end. At that point, we'll get rid of those system calls and just "move" data between a shared memory ring and sockets. The rest is something we could probably try to improve on in the shorter term, for example by trying to get bigger chunks of data at a time and reducing the wakeup frequency ( CPU load is 15-18% at the same transfer rate. The transfer hangs at the end (this would need the same adaptive logic we have in So this is something we could consider, even though, again, that CPU load shouldn't look that scary, because it's quite adaptive. I didn't look into Scenario 2 yet. |
After rebooting my system to start with a clean slate, I started my Wireguard container and observed eight As an additional piece of info, I am using Quadlet ( No options aside from the heading ( |
|
jumping in to say that I'm experiencing the exact same issue, running almost an identical configuration as OP (I'm also using Quadlet to run the VPN container). Feels good not to be alone, this thing was driving me crazy. As a piece of additional information that could help zero in on this, I'll say that I've been running this configuration for more than 4 month now and the issue started only recently (the last month or so). host:
arch: amd64
buildahVersion: 1.37.1
cgroupControllers:
- cpu
- memory
- pids
cgroupManager: systemd
cgroupVersion: v2
conmon:
package: conmon-2.1.12-1.fc40.x86_64
path: /usr/bin/conmon
version: 'conmon version 2.1.12, commit: '
cpuUtilization:
idlePercent: 98.31
systemPercent: 1.14
userPercent: 0.55
cpus: 4
databaseBackend: sqlite
distribution:
distribution: fedora
variant: cloud
version: "40"
eventLogger: journald
freeLocks: 2040
hostname: hekate
idMappings:
gidmap:
- container_id: 0
host_id: 1001
size: 1
- container_id: 1
host_id: 589824
size: 65536
uidmap:
- container_id: 0
host_id: 1001
size: 1
- container_id: 1
host_id: 589824
size: 65536
kernel: 6.10.6-200.fc40.x86_64
linkmode: dynamic
logDriver: journald
memFree: 933859328
memTotal: 6203207680
networkBackend: netavark
networkBackendInfo:
backend: netavark
dns:
package: aardvark-dns-1.12.1-1.fc40.x86_64
path: /usr/libexec/podman/aardvark-dns
version: aardvark-dns 1.12.1
package: netavark-1.12.2-1.fc40.x86_64
path: /usr/libexec/podman/netavark
version: netavark 1.12.2
ociRuntime:
name: crun
package: crun-1.15-1.fc40.x86_64
path: /usr/bin/crun
version: |-
crun version 1.15
commit: e6eacaf4034e84185fd8780ac9262bbf57082278
rundir: /run/user/1001/crun
spec: 1.0.0
+SYSTEMD +SELINUX +APPARMOR +CAP +SECCOMP +EBPF +CRIU +LIBKRUN +WASM:wasmedge +YAJL
os: linux
pasta:
executable: /usr/bin/pasta
package: passt-0^20240814.g61c0b0d-1.fc40.x86_64
version: |
pasta 0^20240814.g61c0b0d-1.fc40.x86_64
Copyright Red Hat
GNU General Public License, version 2 or later
<https://www.gnu.org/licenses/old-licenses/gpl-2.0.html>
This is free software: you are free to change and redistribute it.
There is NO WARRANTY, to the extent permitted by law.
remoteSocket:
exists: true
path: /run/user/1001/podman/podman.sock
rootlessNetworkCmd: pasta
security:
apparmorEnabled: false
capabilities: CAP_CHOWN,CAP_DAC_OVERRIDE,CAP_FOWNER,CAP_FSETID,CAP_KILL,CAP_NET_BIND_SERVICE,CAP_SETFCAP,CAP_SETGID,CAP_SETPCAP,CAP_SETUID,CAP_SYS_CHROOT
rootless: true
seccompEnabled: true
seccompProfilePath: /usr/share/containers/seccomp.json
selinuxEnabled: true
serviceIsRemote: false
slirp4netns:
executable: ""
package: ""
version: ""
swapFree: 6202322944
swapTotal: 6202322944
uptime: 24h 59m 31.00s (Approximately 1.00 days)
variant: ""
plugins:
authorization: null
log:
- k8s-file
- none
- passthrough
- journald
network:
- bridge
- macvlan
- ipvlan
volume:
- local
registries:
search:
- registry.fedoraproject.org
- registry.access.redhat.com
- docker.io
store:
configFile: /home/podman/.config/containers/storage.conf
containerStore:
number: 4
paused: 0
running: 4
stopped: 0
graphDriverName: overlay
graphOptions: {}
graphRoot: /home/podman/.local/share/containers/storage
graphRootAllocated: 428340129792
graphRootUsed: 24915517440
graphStatus:
Backing Filesystem: btrfs
Native Overlay Diff: "true"
Supports d_type: "true"
Supports shifting: "false"
Supports volatile: "true"
Using metacopy: "false"
imageCopyTmpDir: /var/tmp
imageStore:
number: 6
runRoot: /run/user/1001/containers
transientStore: false
volumePath: /home/podman/.local/share/containers/storage/volumes
version:
APIVersion: 5.2.1
Built: 1723593600
BuiltTime: Wed Aug 14 02:00:00 2024
GitCommit: ""
GoVersion: go1.22.5
Os: linux
OsArch: linux/amd64
Version: 5.2.1please let me know if there's anything else I can provide to help with this. |
Do you happen to know starting from which version of Podman and pasta (the package is named |
I started noticing the issue around the beginning of August. Looking at my DNF history I can make some educated guesses. Packages Altered:
Upgrade podman-5:5.2.0~rc2-1.fc40.x86_64 @updates-testing
Upgraded podman-5:5.1.2-1.fc40.x86_64 @@Systemor this one (August 4th): Packages Altered:
Upgrade aardvark-dns-2:1.12.1-1.fc40.x86_64 @updates-testing
Upgraded aardvark-dns-2:1.11.0-3.fc40.x86_64 @@System
Upgrade glibc-2.39-22.fc40.x86_64 @updates-testing
Upgraded glibc-2.39-17.fc40.x86_64 @@System
Upgrade glibc-common-2.39-22.fc40.x86_64 @updates-testing
Upgraded glibc-common-2.39-17.fc40.x86_64 @@System
Upgrade glibc-gconv-extra-2.39-22.fc40.x86_64 @updates-testing
Upgraded glibc-gconv-extra-2.39-17.fc40.x86_64 @@System
Upgrade glibc-langpack-en-2.39-22.fc40.x86_64 @updates-testing
Upgraded glibc-langpack-en-2.39-17.fc40.x86_64 @@System
Upgrade glibc-locale-source-2.39-22.fc40.x86_64 @updates-testing
Upgraded glibc-locale-source-2.39-17.fc40.x86_64 @@System
Upgrade glibc-minimal-langpack-2.39-22.fc40.x86_64 @updates-testing
Upgraded glibc-minimal-langpack-2.39-17.fc40.x86_64 @@System
Upgrade libgcc-14.2.1-1.fc40.x86_64 @updates-testing
Upgraded libgcc-14.1.1-7.fc40.x86_64 @@System
Upgrade libgomp-14.2.1-1.fc40.x86_64 @updates-testing
Upgraded libgomp-14.1.1-7.fc40.x86_64 @@System
Upgrade libstdc++-14.2.1-1.fc40.x86_64 @updates-testing
Upgraded libstdc++-14.1.1-7.fc40.x86_64 @@System
Upgrade netavark-2:1.12.1-1.fc40.x86_64 @updates-testing
Upgraded netavark-2:1.11.0-3.fc40.x86_64 @@System
Upgrade podman-5:5.2.0-1.fc40.x86_64 @updates-testing
Upgraded podman-5:5.2.0~rc2-1.fc40.x86_64 @@SystemThe only update I see for |
|
my bad. There was another update on the 28 of July. Sorry I missed it. Packages Altered:
Upgrade passt-0^20240726.g57a21d2-1.fc40.x86_64 @updates-testing
Upgraded passt-0^20240624.g1ee2eca-1.fc40.x86_64 @@System
Upgrade passt-selinux-0^20240726.g57a21d2-1.fc40.noarch @updates-testing
Upgraded passt-selinux-0^20240624.g1ee2eca-1.fc40.noarch @@Systemthe one before was of on June the 25th, but it feels too early and the the one after that was on August 9 (too late). |
|
Any chance you could try downgrading to |
I can't seem to find the old package. Not easily at least. do you know where I can get it? |
|
I managed to dowgrade to podman 1138 0.5 0.4 72424 27420 ? Ss 14:16 0:01 /usr/bin/pasta --config-net --address 10.0.2.0 --netmask 24 --gateway 10.0.2.2 --dns-forward 10.0.2.3 --pid /run/user/1001/containers/networks/rootless-netns/rootless-netns-conn.pid -t none -u none -T none -U none --no-map-gw --quiet --netns /run/user/1001/containers/networks/rootless-netns/rootless-netns
podman 1263 0.0 0.0 1745796 5268 ? Sl 14:16 0:00 rootlessport
podman 1273 0.0 0.0 1598332 4836 ? Sl 14:16 0:00 rootlessport-child
podman 1377 1.0 0.0 1819784 5696 ? Sl 14:16 0:02 rootlessport
podman 1382 0.0 0.0 1524344 4988 ? Sl 14:16 0:00 rootlessport-child |
|
It is notably better, but I can't say for certain that it is back to "normal". I will have to invest some more time checking and testing. |
I'm not sure how you solved this, and for how long Fedora packages are retained, but we keep a permanent mirror of Copr builds (including Fedora packages) at https://passt.top/builds/copr/.
Thanks, this is extremely helpful. |
|
Thank you! I used the mirror and I was able to downgrade to /usr/bin/pasta --config-net --address 10.0.2.0 --netmask 24 --gateway 10.0.2.2 --dns-forward 10.0.2.3 --pid /run/user/1001/containers/networks/rootless-netns/rootless-netns-conn.pid -t none -u none -T none -U none --no-map-gw --quiet --netns /run/user/1001/containers/networks/rootless-netns/rootless-netns |
|
I tested |
Your original reproducer didn't show you using a custom network, that uses a different architecture from the default pasta network mode, i.e. see #22943 (comment) So using rootlessport is normal when using custom networks. And But I do agree that pasta numbers look way to high for the amount of throughput. |
|
@pwige Hi. I'm looking specifically at Scenario 2. As @sbrivio-rh notes that looks like a regression caused by the flow table, which I imlpemented. Unfortunately, I haven't yet been able to reproduce the problem. I ran the wireguard container as described and ran a speedtest through it. While the transfer speeds are significantly slower than without the tunnel, they were still respectable (6-18 Mbps depending on which exact variant). pasta CPU usage topped out at 10-20%. I'm not seeing any rootlessport processes. There are a lot of possible differences between my setup and yours, so I don't have a quick guess as to which one is making the difference. So, here's a grab bag of questions, hoping that something will give a clue as to what the triggering circumstances are:
|
Sorry, somehow missed that option on the speedtest page. Found it now. Did some further testing, and I sometimes see pasta CPU load up to 45-50%, but throughput still seems respectable. |
Rootlessport is used when using the bridge mode (i.e. custom networks) and is started before the container. They handle all port forwarding traffic and in this case (so no pasta port forward option involved). The traffic that goes through pasta in this case are only the connections initiated from the container (i.e. the ones that are not a directly reply to the ip/port from rootlessport). So in scenario 2 it would very much depend on how wireguard binds/connects to the udp sockets to know how the connection is flowing. |
|
I'm using version I'm running
Pausing the seeding torrents does not have an effect on the load of the process, so despite receiving no substantial traffic, the process continues to saturate its thread. EDIT: I should've mentioned that this problem was happening using the default |
Ok, so I'm a bit confused at this point. The original instructions for reproducing don't seem to be setting up a custom network - just starting a regular container. However the presence of rootlessport seems to indicate that there is a custom network in play. @pwige can you shed some light on what network configuration you're using? |
Huh, interesting. The good news is this strongly suggests we're doing something Just Plain Wrong (as opposed to a more subtle inefficiency), and once we find it, it should be a relatively easy fix. The bad news is that I don't yet have any good theories as to what's going on. |
|
Did some further testing thanks to you guys pointing out that rootless port is only needed in cases where a custom network is used and I can confirm that the problem is NOT present when using the default network (or the host network). Sorry if I've not mentioned this before, but this was out of sheer ignorance on my part. Please let me know if there's anything else I can test or information I can provide about this. P.S. this whole thing has been hugely educational for me and has made me realize that my setup (where I have multiple containers using a custom network) is not very efficient CPU wise. Could you guys give me a pointer as to what would be a better way to have multiple containers communicate with each other? If that needs to be a longer conversation I'd be happy to post a question in discussion or do some further research myself. Thanks anyway :) |
|
@dgibson Hi!
The extremely slow speeds I had previously seen were around 0.5MB/s down and 0.1MB/s up. A "clean" speedtest where I'm not connected to the vpn gives me ~450MB/s down and ~165MB/s up. Here are two videos showing the speedtest on the client and the CPU usage on the server as they happened in real-time. The client was my laptop, which exists on the same physical network as the server. multi-connection.mp4single-connection.mp4Despite the speeds shown here being not nearly as bad as they were previously (no complaints here), the CPU usage isn't noticeably different. I'm not sure what could account for the change in throughput other than general instability from my ISP, as I haven't changed anything on my end. It make me a bit embarrassed tbh. I haven't had the opportunity today to perform this test when connected to a different physical network, but may have the chance to tomorrow.
I'm on Arch, so I can't use any of the Copr builds. I can build from source from tags 2024_06_24.1ee2eca or 2024_06_07.8a83b53. Please let me know if simply copying the resulting
The server is running in a rootless container directly on the host. The client(s) are other devices connected to the same physical network. As mentioned above, I might have the chance to test from different physical networks tomorrow.
The first eight appear immediately after starting the container. I can get an additional
I am using an Intel NUC5i7RYH, with the containers running directly on the host. I haven't imposed any resource limits on the container, so the it have unimpeded access to all 2 cores (4 threads) and all 16GB of RAM. The device itself is connected to my home LAN via ethernet. |
The steps I provided to reproduce the issue don't use a custom network, something which I am doing in "production." That's an oversight on my part. Sorry! I've updated the issue's original text to reflect this. My network configuration is defined in a Quadlet |
|
By the way:
I tried to reproduce this case, but I couldn't, at least not yet. Perhaps it's because of the torrent content I chose (Linux distribution images): I download very fast (50-100 MB/s, and pasta reaches 40-50% load on a CPU thread) but seeding is not constantly using so much bandwidth. I see spikes in upload rates from time to time, but otherwise I'm constantly seeding at some dozen KB/s to a handful of peers. It would be interesting if you could share the output of one second or less of |
|
@pwige, thanks for the additional information. Between your comment and the one from @kalelkenobi it certainly seems like this is triggered by the custom network setup. I'm suspecting maybe some sort of forwarding loop between pasta and rootlesskit. I'm not really familiar with quadlet and custom network configuration though, @Luap99 any chance you could interpret @pwige's configuration into specific commands I'd need to run to create something similar? |
@sbrivio-rh: I gave it a Try now on Proxmox VE where I build everything from Source related to Podman (just upgraded to Podman 5.4.0 amongst other Things). I'd say the CPU Load related to |
So, I tried a while ago, but I can't reproduce this. I used some sample MP3 files, not actual audiobooks. I stream them for a while, and yes, I see splice() system calls for rather small quantity of data. However they're not frequent enough to cause any noticeable CPU load. They come at most every few dozen milliseconds. @kylem0 I would have three requests:
Thanks. |
|
I tried a bit of Find the Process ID using: Trace Command: I took a few Seconds of Tracing. 30k Lines in Total out of which 3k Lines / 10% are Not sure how much sensitive Information is contained in those Trace Dumps (I could see only 1 Time a Part on an IPv6 Prefix). Most of the stuff is sort-of Encoded ? |
Hey, thanks, but, despite being @luckylinux, you don't have this issue "unfortunately". :) Yours is 1. not high CPU load and 2. not on the splice()d (loopback) path, where we're seeing those new reports. By the way:
Oh, a lot, I could see the whole data (that's octal encoding of bytes we read/write). But if it's SSL I can't read much into it. |
|
@sbrivio-rh: Sad to hear to some Extent 😥 . Maybe it's more what @kylem0 reported, as I'm also using Caddy. I still do NOT find it normal to be using 20-30% CPU when basically there are less than 2 Users (plus 5 Cameras getting streamed by Frigate). Imagine if this was a 1000 Users Visits/Second Website. It isn't going to fly. I'll maybe try to run a customized NGINX Entrypoint instead of Caddy as an entrypoint. Or Traefik possibly (but I might go full-nginx directly since that probably offers the best Performance). |
The CPU load you see is actually very adaptive, as I analysed and explained in: #23686 (comment). TL;DR: with more requests we get proportionally less frequent wake-ups and we read bigger chunks of data. It actually scales. We run TCP CRR (connection-request-response) tests and they look pretty good, (> dozen) thousand connections per second are not a problem. Improving the situation further than that is something I'd defer to VDUSE support. |
So you don't think it's even worth it to try replacing Caddy with NGINX to rule out Caddy as a Possible Issue/Factor ? |
In the problematic case, yes, definitely worth a try I would say. @kylem0 ^^. But in your case (different data path) I don't really see a problem, and I doubt you would see a difference. |
|
@sbrivio-rh I was able to reproduce the issue with nginx as well. At first my nginx config didn't work with websockets and the AudiobookShelf UI showed an error establishing a websocket connection. There was no high CPU usage without the websocket connection. I updated my nginx config to work with websockets and now I have 2 100% pasta processes (for audiobookshelf and nginx). This is a pretty vanilla ARM64 Fedora CoreOS VM, but I initially saw the issue on my x86_64 Arch bare-metal server. --net pasta:--traceI feel like I'm losing my mind. If I add proxy: audiobookshelf: FlamegraphLet me know if I can improve this at all, I don't use/create flamegraphs often:
StraceLet me know what other info I can provide. I can try to reproduce the issue with something like Jellyfin and a proxy if that would help. I think Jellyfin and AudiobookShelf are the only 2 service I've seen this issue with, but they're also the only 2 services that use websockets that I run that I can think of. |

Thanks a lot for all the tests.
At least you have a workaround :) By default the log file is limited to one meg, so that won't bother you.
! kernel> you got data
That's everything I need at the moment I think. This looks like a side effect of https://passt.top/passt/commit/tcp_splice.c?id=7e6a606c32341c81b0889a6791ec12e418a4eeec, which is however correct. I have a number of ideas now, I'll need a bit to try them out. |
...or more subtly: kernel> you got data It looks like the receiver isn't receiving, quite simply, and then we should just wait. Yeah, it sounds like obvious functionality, but I think that this issue was hidden by another, less obvious one (the commit I pointed out, probably) we recently fixed. Could you please try this (lightly tested) patch: ? |
|
@sbrivio-rh I think that solves my issue! I played an audio book for ~10 minutes and the pasta processes weren't visible in It looks like Fedora CoreOS is using an older version of pasta, I built the the latest tag without any changes and the issues is present, so I think the small change fixes it. |
Hah, great.
Not long, I ran the tests now, I'm pondering to write a test with receivers intermittently blocking to reproduce something similar to your case. Even if I can't reproduce this, though, the change looks relatively obvious (in hindsight ;)) and safe, so better included than not. If we could get the OP of https://www.reddit.com/r/podman/comments/1iph50j/pasta_high_cpu_on_podman_rootless_container/ to also test it I would be somewhat more confident, let's see. I plan to make anyway a new release within a couple of days as we fixed a few somewhat critical issues in the past week. |
If we set the OUT_WAIT_* flag (waiting on EPOLLOUT) for a side of a
given flow, it means that we're blocked, waiting for the receiver to
actually receive data, with a full pipe.

In that case, if we keep EPOLLIN set for the socket on the other side
(our receiving side), we'll get into a loop such as:

  41.0230:          pasta: epoll event on connected spliced TCP socket 108 (events: 0x00000001)
  41.0230:          Flow 1 (TCP connection (spliced)): -1 from read-side call
  41.0230:          Flow 1 (TCP connection (spliced)): -1 from write-side call (passed 8192)
  41.0230:          Flow 1 (TCP connection (spliced)): event at tcp_splice_sock_handler:577

leading to 100% CPU usage, of course.

Drop EPOLLIN on our receiving side as long when we're waiting for
output readiness on the other side.

Link: containers/podman#23686 (comment)
Link: https://www.reddit.com/r/podman/comments/1iph50j/pasta_high_cpu_on_podman_rootless_container/
Reviewed-by: David Gibson <david@gibson.dropbear.id.au>
Signed-off-by: Stefano Brivio <sbrivio@redhat.com>
|
Issue on spliced/loopback path fixed in passt 2025_02_17.a1e48a0, matching Fedora Rawhide update, and the Arch maintainer already picked it up: https://gitlab.archlinux.org/archlinux/packaging/packages/passt/-/commit/47f7605d1d88095e49f39577417ea00af6d3b28a. |
|
@sbrivio-rh That was faster than I thought haha. I've updated my home server and I can't reproduce the 100% CPU usage. Thank you very much for the help! |
This introduces vhost-user support with --vhost-user.

Notable fixes:

- possible EPOLLRDHUP event storms with half-closed TCP connections,
  leading to periods of high CPU load:
  containers/podman#23686 and
  https://bugs.passt.top/show_bug.cgi?id=94

- possible EPOLLERR event storms with UDP flows:
  https://bugs.passt.top/show_bug.cgi?id=95

- properly handle TCP keep-alive segments:
  containers/podman#24572

- set PSH flag at end of TCP batches:
  https://bugs.passt.top/show_bug.cgi?id=107

Signed-off-by: Stefano Brivio <sbrivio@redhat.com>
|
Hello, I am having high cpu load with the latest pasta again recently: ❯ pasta --version Can someone check please? Thank you |
...meaning? What kind of CPU load? While doing what?
...no known issue with this regard at the moment. |
pasta service related to podman container (nextcloud) went up to 100% ❯ top -bn1 -p 610499
top - 18:01:31 up 13:39, 4 users, load average: 0,94, 0,51, 0,29
Tasks: 1 total, 1 running, 0 sleeping, 0 stopped, 0 zombie
%Cpu(s): 3,7 us, 11,1 sy, 0,0 ni, 85,2 id, 0,0 wa, 0,0 hi, 0,0 si, 0,0 st
MiB Mem : 31708,3 total, 22055,1 free, 3112,9 used, 7288,2 buff/cache
MiB Swap: 8192,0 total, 8192,0 free, 0,0 used. 28595,4 avail Mem
PID USER PR NI VIRT RES SHR S %CPU %MEM TIME+ COMMAND
610499 pod 20 0 206260 16956 1180 R 100,0 0,1 4:52.12 pasta.avx2❯ ps -up 610499
USER PID %CPU %MEM VSZ RSS TTY STAT START TIME COMMAND
pod 610499 2.6 0.0 206260 16956 ? Rs 14:49 5:03 /usr/bin/pasta --configIt happened several times in the last 2-3 days without any real hard usage of the containers. When I restart the container it goes back to normal CPU usage but later suddenly produces the same phenomenon. I used to have this issue with podman / pasta but recently this seemed to be solved up until the last 2-3 days when it came up again. Thanks |
|
@arajczy could you |
|
Hah, thanks a lot. It looks very similar to what I fixed recently in https://passt.top/passt/commit/?id=667caa09c6d46d937b3076254176eded262b3eca, but there must be something else. What's particular here is that the writer on pasta's reading side is done (it sent a FIN / shutdown(x, SHUT_RW)), but the receiver on pasta's writing side isn't ready. I guess we should make sure that the same conceptual change from that commit also covers this particular case. Maybe in tcp_splice_sock_handler() we should move: before: but I didn't really think it through yet (let alone tested). |
|
@sbrivio-rh, @arajczy, I think I've spotted the cause of the latest problem here. Patches coming shortly, with any luck. |
|
@arajczy patches are at https://archives.passt.top/passt-dev/20250409063541.1411177-1-david@gibson.dropbear.id.au/. Would you have a chance to try them out? It takes just a few seconds to build passt / pasta locally:
|
|
@sbrivio-rh, I have followed your steps and installed patches. Let me monitor my system for a while - will let you know the results. Thank you |
|
@sbrivio-rh, @dgibson, looking at the past two days, it seems you have solved the issue. After cca. 12:00 CET on 9th April, when I applied the patch, you can't really see high peaks: |


Thanks for confirming. Let's ship it then! By the way those charts look pretty sleek. |
|
At least the part of this issue reported in #23686 (comment) is now fixed in passt 2025_04_15.2340bbf (and matching Fedora 41 update). |
Issue Description
I'm encountering unexpectedly high CPU load from
pastaandrootlessportwhen running certain network operations.Scenario 1 – Downloading large files:
Downloading Hetzner test files (although any large file download should do) from within a rootless container.
Scenario 2 – Wireguard VPN server:
Hosting a Wireguard server in a rootless container using the docker.io/linuxserver/wireguard image.
Steps to reproduce the issue
Steps to reproduce the issue:
Scenario 1:
wgetand CPU usage reported byhtop.If Hetzner's Ashburn datacenter is far from you, check their other locations and modify the URL's subdomain as needed.
Scenario 2:
peer1.conffile stored within the container itself.htop.Describe the results you received
Scenario 1:
When downloading Hetzner test files with
wgetin a rootless container I reach consistent download speeds of around ~43MiB/s, but htop reports thepastaprocess using ~40-43% CPU load.Scenario 2:
Running a network speedtest on the client using results in extremely slow network speeds reported on the client and very high CPU load on the server.
htopshows 90-100% CPU load from thepastaprocess and 10-17% CPU load from severalrootlessportprocesses.Wireguard's poor performance renders it essentially unusable. I was told the CPU load is unexpectedly high and that I should raise a bug report here. Please let me know if what I am encountering is actually to be expected from rootless containers.
Describe the results you expected
I expected less severe CPU load from the rootless networking backend and better performance/network speeds via the Wireguard VPN tunnel.
podman info output
Podman in a container
No
Privileged Or Rootless
Rootless
Upstream Latest Release
Yes
Additional environment details
Running a fresh Arch installation on an Intel NUC5i7RYH, which is connected to my home's router via ethernet. No other services or containers running during testing.
Additional information
The experience I described above is consistent.
The text was updated successfully, but these errors were encountered: