Machine learning is a subfield of artificial intelligence, which is broadly defined as the capability of a machine to imitate intelligent human behavior. Artificial intelligence systems are used to perform complex tasks in a way that is similar to how humans solve problems.
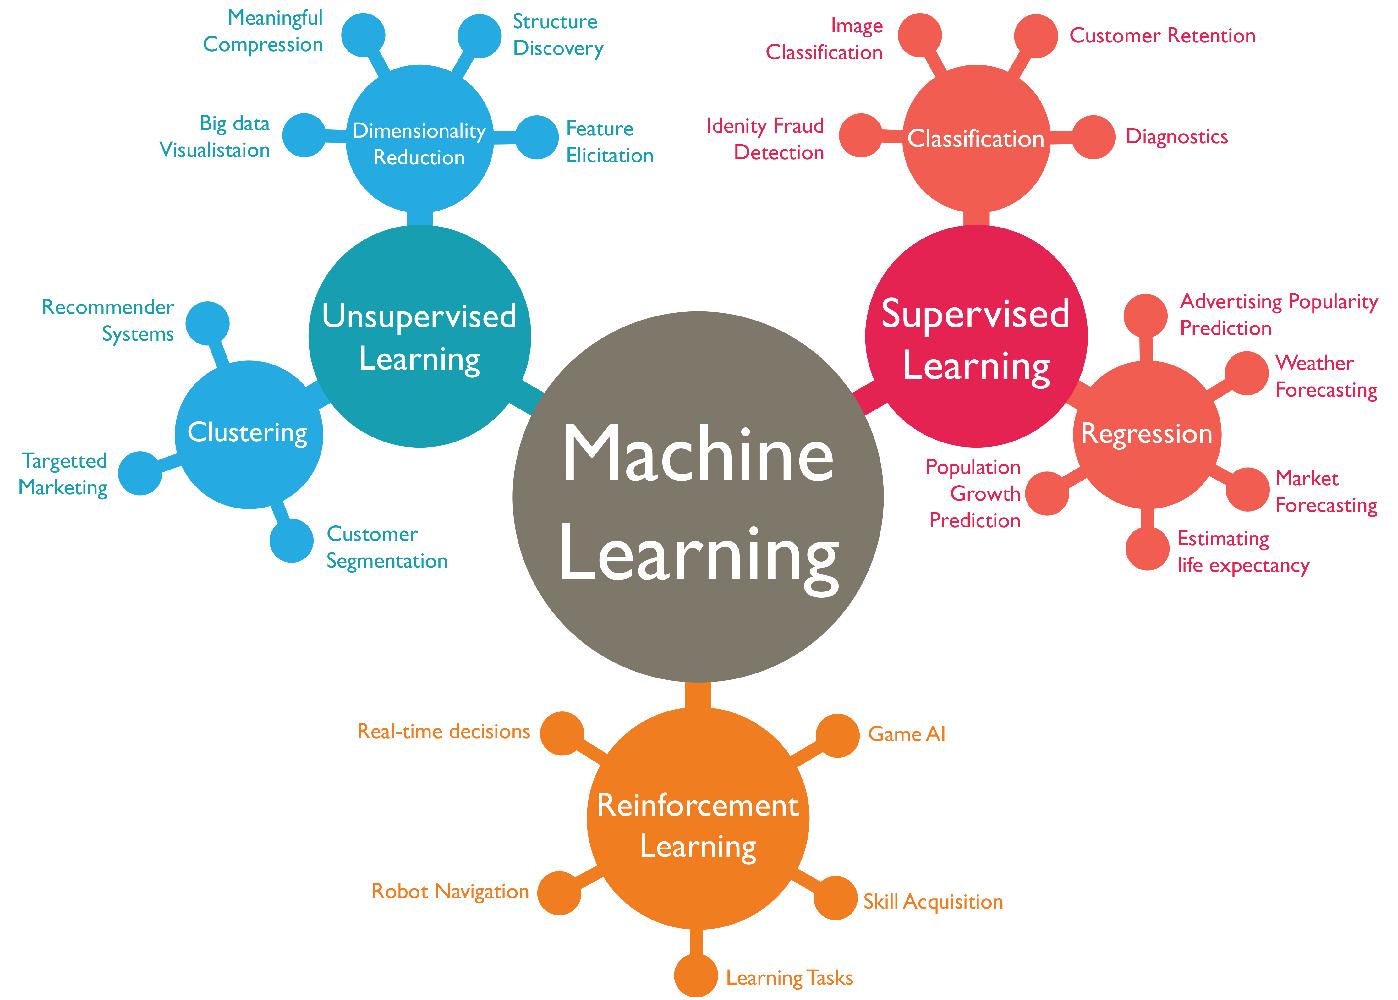
Using R for unsupervised learning such as dimensionality reduction, & clustering. The different practices are also for building, & comparing different supervised classifiers.
(1) Fit a decision tree to the training data with an optimal tree size determined by 5-fold cross-validation. Create a plot of the pruned tree and interpret the results. Compute the test error rate of the pruned tree.
(2) Fit a random forest to the training data with the parameter of the number of features to create the splits tuned by 5-fold cross-validation. Set the number of trees to 1000. Compute the test error rate and comment on the results. Create a plot showing variable importance for the model with the tuned parameter and comment on the plot.
(3) Draw one plot with two ROC curves for the test predictions in (1) and (2). Comment on the plot.
Simulate a three-class dataset with 50 observations in each class and two features. Make sure that this dataset is not linearly separable.
(1) Make a scatter plot to show your dataset.
(2) Split the dataset to a training set (50%) and a test set (50%). Train the support vector machine with a linear kernel, a polynomial kernel and an RBF kernel on the training data. The parameters associated with each model should be tuned by 5-fold cross-validation. Test the models on the test data and discuss the results.
Download the newthyroid.txt data from moodle. This data contain measurements for normal patients and those with hyperthyroidism. The first variable class=n if a patient is normal and class=h if a patients suffers from hyperthyroidism. The rest variables feature1 to feature5 are some medical test measurements.
(1) Apply kNN and LDA to classify the newthyroid.txt data: randomly split the data to a training set (70%) and a test set (30%) and repeat the random split 10 times. For kNN, use 5-fold cross-validation to choose k from (3, 5, 7, 9, 11, 13, 15). Use AUC as the metric to choose k, i.e. choose k with the largest AUC. Record the 10 test AUC values of kNN and LDA in two vectors.
(2) Draw two boxplots in one plot based on the 10 AUC values of kNN and LDA.
(3) What conclusions can you make from the classification results of kNN and LDA on the newthyroid.txt data?
Use this function to produce the training indexes for 10-fold cross-validation on the Ger- manCredit data. For information and comments, please see the r script for question 4, thank you.