XDebug
XDebug enable you to place Breakpoints into your code, this enables you to found variables and values in runtime
If you have javanile/vtiger-dev image and run the debug command, you are ready to use XDebug with PhpStorm.
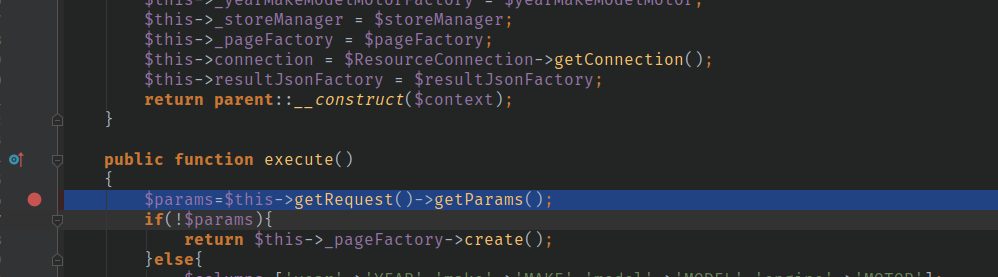
STEP #1: Add breakpoints where you need to debug using click on corresponding code.
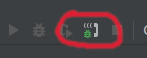
STEP #2: Check if PhpStorm is ready to listen for debug information
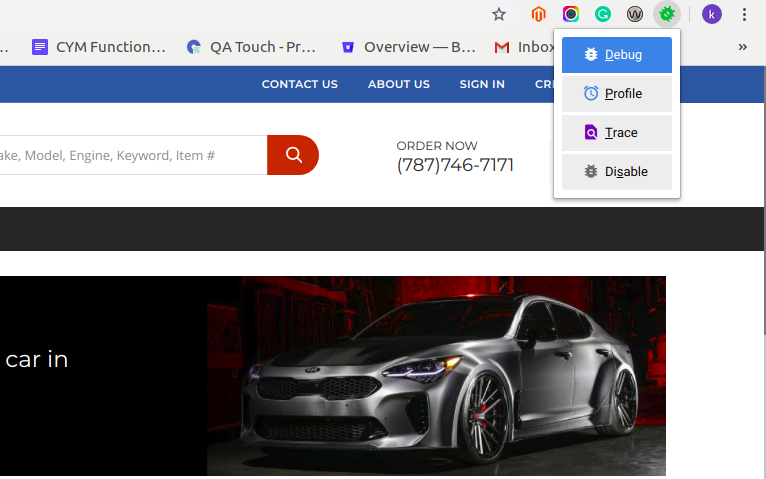
STEP #3: Check if Chrome is ready to send debug information
STEP #4: Now, you should load the page where you must execute the breakpoints, which has been mentioned above in PhpStorm. After some time, the PhpStorm will show the variable values which you must select as the breakpoint. Then, press F7 to bring up the flow on how the final output should be displayed.
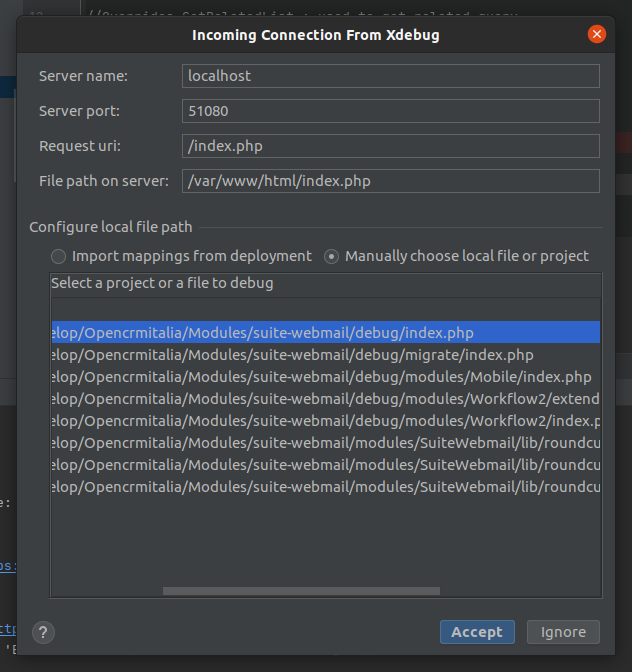
STEP #5: Set the right file mapping in general we have that /var/www/html/ is mapped to debug/ look the image below
This debugging of code using Xdebug and PhpStorm can be beneficial for your development in the debug process, thus helping you save the amount of time spent searching on Google.