-
Notifications
You must be signed in to change notification settings - Fork 401
Profiler
Mikulas Florek edited this page Mar 25, 2015
·
12 revisions
The profiler reports how much time is spent in different parts of engine. This is very helpful when you want to optimize your game. Parts of the engine you want to track must be marked by following macros:
- BEGIN_PROFILE_BLOCK / END_PROFILE_BLOCK
- PROFILE_FUNCTION
- PROFILE_BLOCK
Profiler window

void Material::apply(Renderer& renderer, PipelineInstance& pipeline) const
{
	PROFILE_FUNCTION();
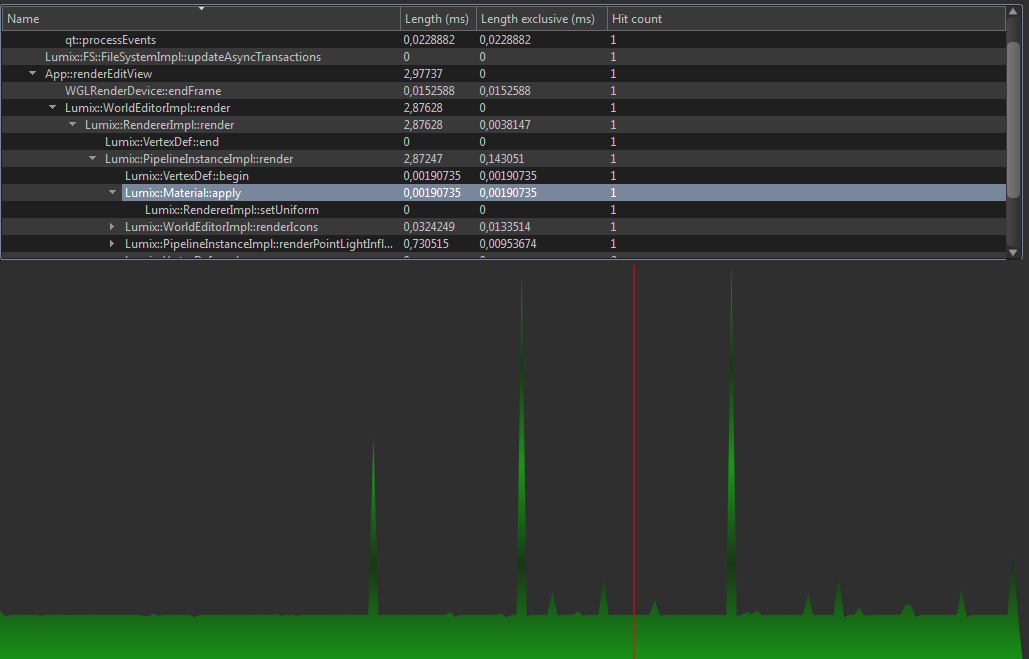
To start profiling your game it is necessary to check the first checkbox. Once this checkbox is checked the list view below is filled with data, and a graph is displayed on the bottom of the window. You can navigate in history by clicking on the graph. The green part of the graph is total time of a frame and once you click on a row in the list view, a blue graph appears and it represents time spent in the selected row each frame.