User Documentation
Documentation is very important, not only for the developers but also for the users. Programs should be as intuitive as possible. Nevertheless, it makes sense to have a manual. Here we document the use of our software and give examples for its use.
After opening the program the following GUI appears:
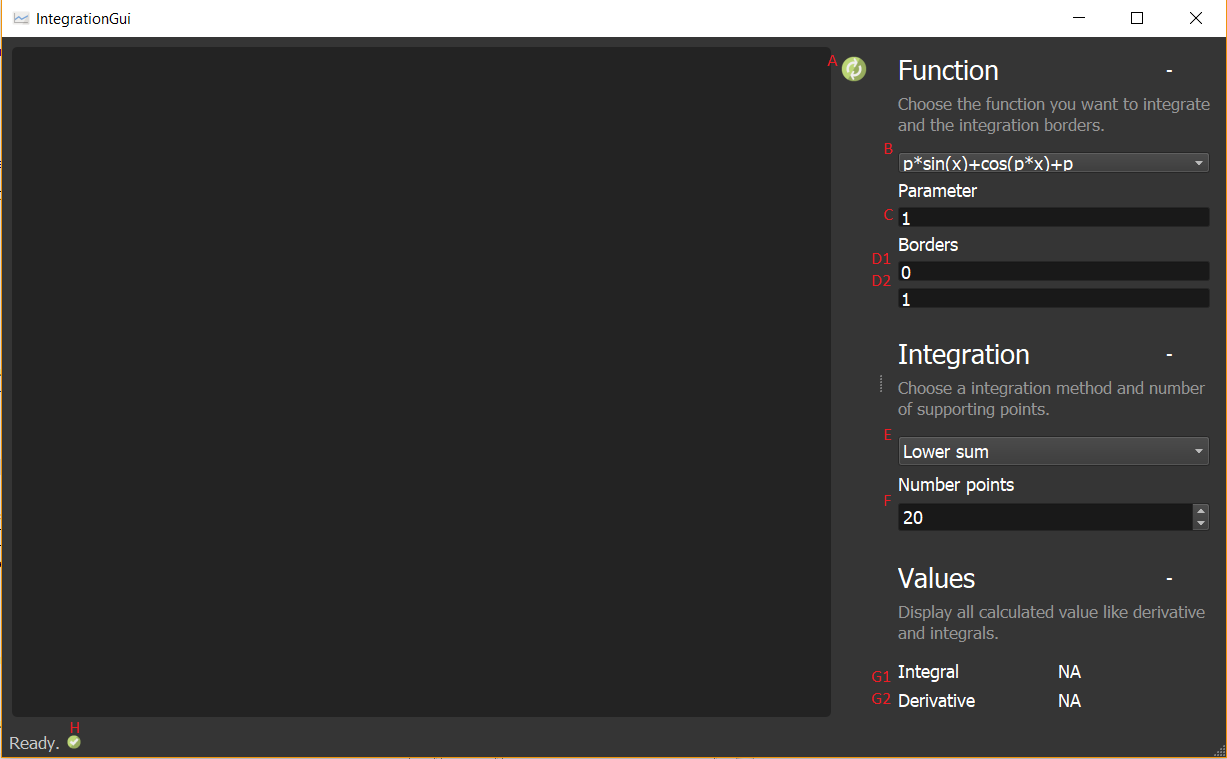
Use the drop-down menu at B to select the desired function. The P parameter can be entered in the C field. The two fields below can be used to set the integral limits. In D1 you enter the lower limit, in D2 you enter the upper limit. The integration method to be used can be selected with the dropdown list at E. In F the number of grid points is determined. It can either be entered directly into the field, or can be changed with the arrows at the end of the bar one number up or down. H indicates the current status. Since nothing has been calculated yet, it says "Ready". For G1 and G2 there are no results yet for the integral. If you want to integrate the function now, press button A. Alternatively you can use the keyboard shortcut Ctrl+R. After the calculation the GUI looks like this:
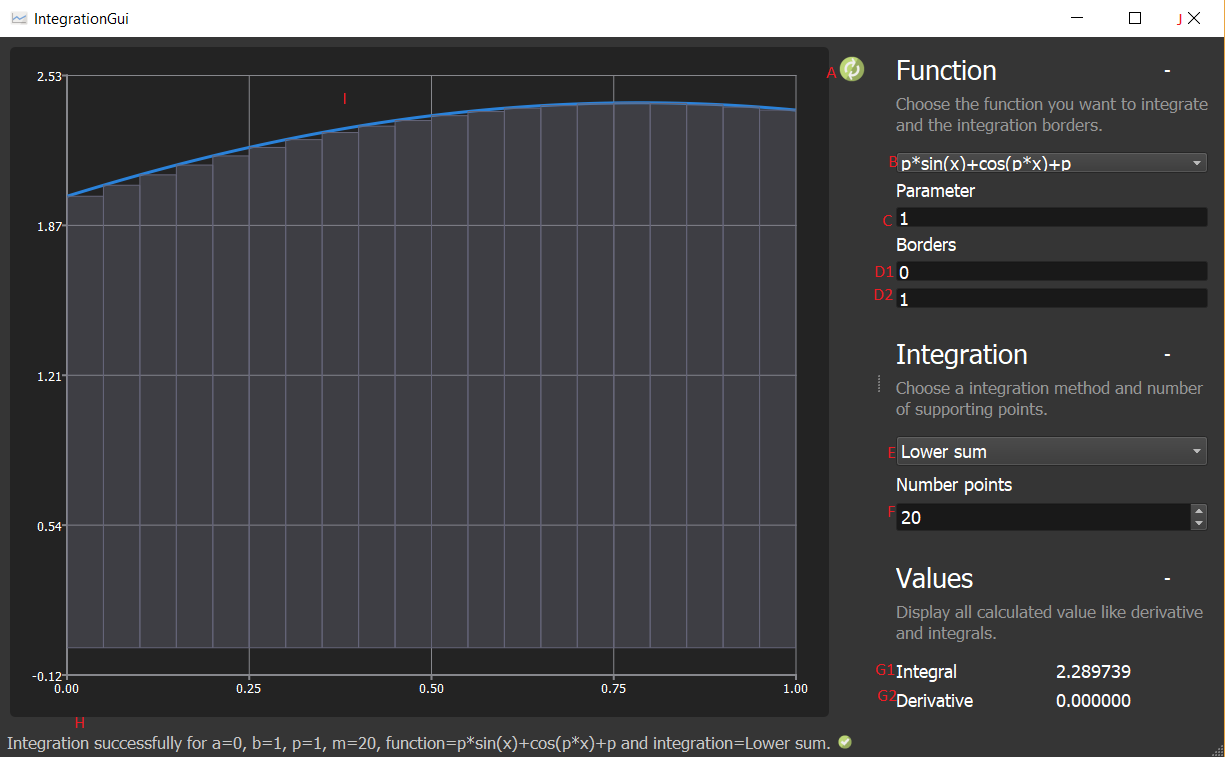
Now the values of the integral and the derivative are displayed under G1 and G2. You can see the plot on the left in the area at I. Under H you can see the current status again. Since something has already been calculated, the currently used parameter, the limits, the used function and integration method, as well as the number of grid points are displayed. If you want to integrate a new function or change the settings, you can do this with A-F as described above. If you want to quit the program instead, you have to click on the X in the upper right corner of J.
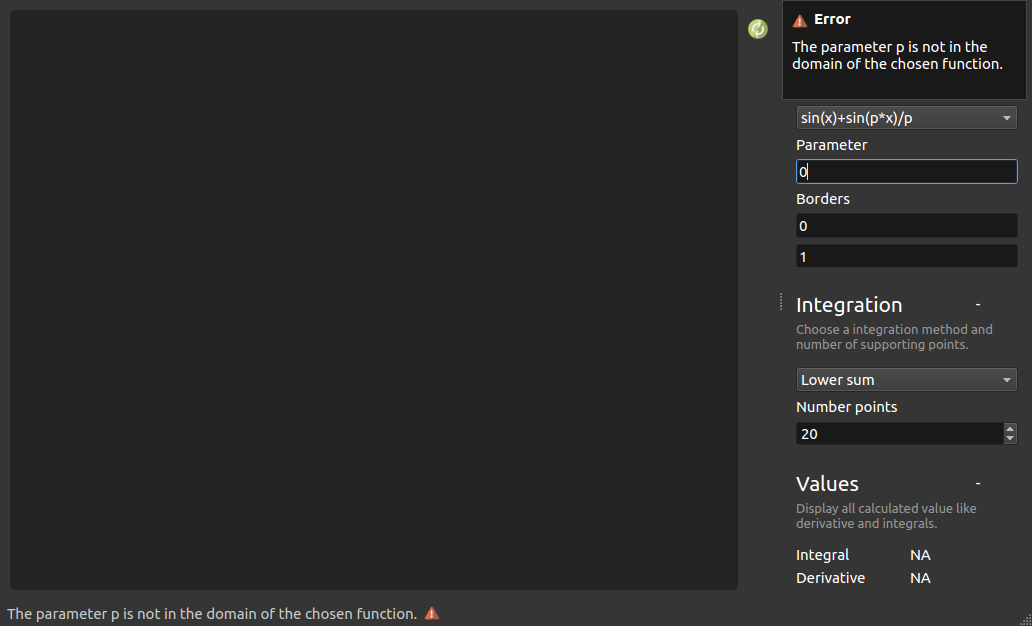
In order to guarantee a stable program, possible error situations are checked after clicking on refresh, but still before the execution and intercepted if necessary. This prevents the program from being executed with invalid parameters. If the program detects an error, it is displayed in the status bar at the bottom left as well as in the information window at the top right. In general it can be said that only one error message is displayed at a time, even if there are two error situations, for example. Only when the first error situation has been corrected will the next one be displayed. It was also taken care from the outset during programming that many error situations could not arise at all due to incorrect entries. For example, no letters can be entered as limits or parameters. The first possible error situation is an incorrect parameter P for the selected function. This is the case, for example, if this would divide by "0". Then the following error message appears: "The parameter p is not in the domain of the chosen function". To correct the error a new parameter must be entered and pressed refresh again. If the new parameter is still invalid, the same procedure must be followed until a valid parameter is entered and the program can execute the calculation. Alternatively, you can keep the parameter and select another function and refresh it again. Then it is checked again whether the parameter matches the function. If this is not the case, you must either select a new parameter or select another function. Here is an illustration to this error situation:
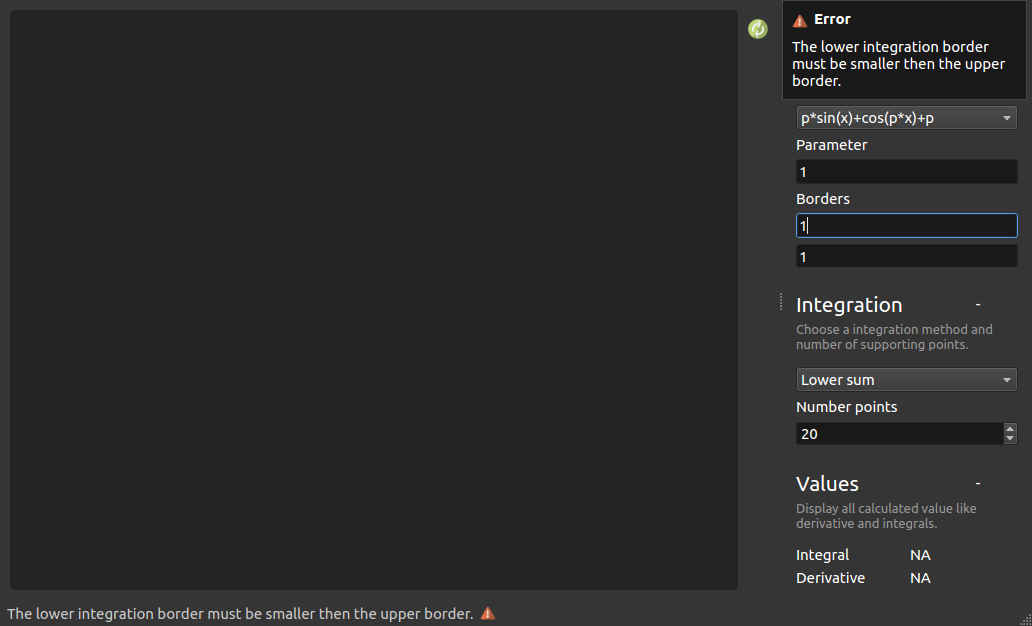
Another error situation is the selection of invalid interval limits. For example, the lower interval limit must be smaller than the upper interval limit. If this is not the case, the following error message appears: The lower integration border must be smaller than the upper border. To correct the error, one of the two boundaries must be adjusted. Either you set the value of the lower border smaller than the value of the upper border, or you set the value of the upper border larger than the value of the lower border. Then press refresh again and the error should be gone. Here is a picture of this error situation:
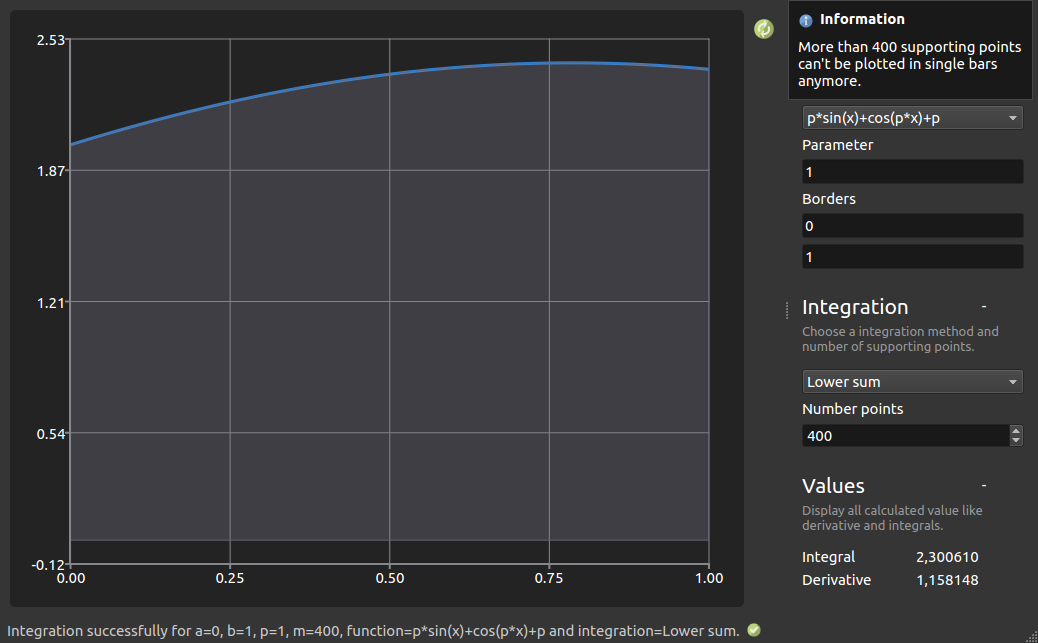
A third error situation is an invalid choice of the number of grid points. Invalid in the sense of a too high number, because the performance of the program would suffer too much. The maximum number of supported markers is limited to 400. If this value is exceeded, the following error message appears: More then 400 supporting points can't be plotted in single bars anymore. The solution is to set the number of supporting points to a value smaller than 401. Accepted values are between 2, which cannot be entered at all, and 400. Then press refresh again and the error should be gone. Here an illustration to this error situation:
Leaving an input field blank also leads to an error situation. Then the following output appears: One or more inputs are empty. Please make sure that all fields are filled. To correct this, the empty input fields must be filled with, best valid, values and pressed refresh again. If the fields were filled with invalid values, the new error message matching this error will appear. The solution to these errors has already been presented.