-
Notifications
You must be signed in to change notification settings - Fork 166
Home

InferCNV is used to explore tumor single cell RNA-Seq data to identify evidence for somatic large-scale chromosomal copy number alterations, such as gains or deletions of entire chromosomes or large segments of chromosomes. This is done by exploring expression intensity of genes across positions of tumor genome in comparison to a set of reference 'normal' cells. A heatmap is generated illustrating the relative expression intensities across each chromosome, and it often becomes readily apparent as to which regions of the tumor genome are over-abundant or less-abundant as compared to that of normal cells.
InferCNV provides access to several residual expression filters to explore minimizing noise and further revealing the signal supporting CNA. Additionally, inferCNV includes methods to predict CNA regions and define cell clusters according to patterns of heterogeneity.
InferCNV is one component of the TrinityCTAT toolkit focused on leveraging the use of RNA-Seq to better understand cancer transcriptomes. To find out more about Trinity CTAT please visit TrinityCTAT.
See Installing inferCNV for installation instructions. You have several choices.
If you have installed infercnv from BioConductor, you can run the example data with:
library(infercnv)

infercnv_obj = CreateInfercnvObject(raw_counts_matrix=system.file("extdata", "oligodendroglioma_expression_downsampled.counts.matrix.gz", package = "infercnv"),
                                    annotations_file=system.file("extdata", "oligodendroglioma_annotations_downsampled.txt", package = "infercnv"),
                                    delim="\t",
                                    gene_order_file=system.file("extdata", "gencode_downsampled.EXAMPLE_ONLY_DONT_REUSE.txt", package = "infercnv"),
                                    ref_group_names=c("Microglia/Macrophage","Oligodendrocytes (non-malignant)"))

infercnv_obj = infercnv::run(infercnv_obj,
                             cutoff=1, # cutoff=1 works well for Smart-seq2, and cutoff=0.1 works well for 10x Genomics
                             out_dir=tempfile(),
                             cluster_by_groups=TRUE,
                             denoise=TRUE,
                             HMM=TRUE)
If you installed infercnv from github, move into the infercnv/example folder and call the run script:
cd inferCNV/example

Rscript ./run.R
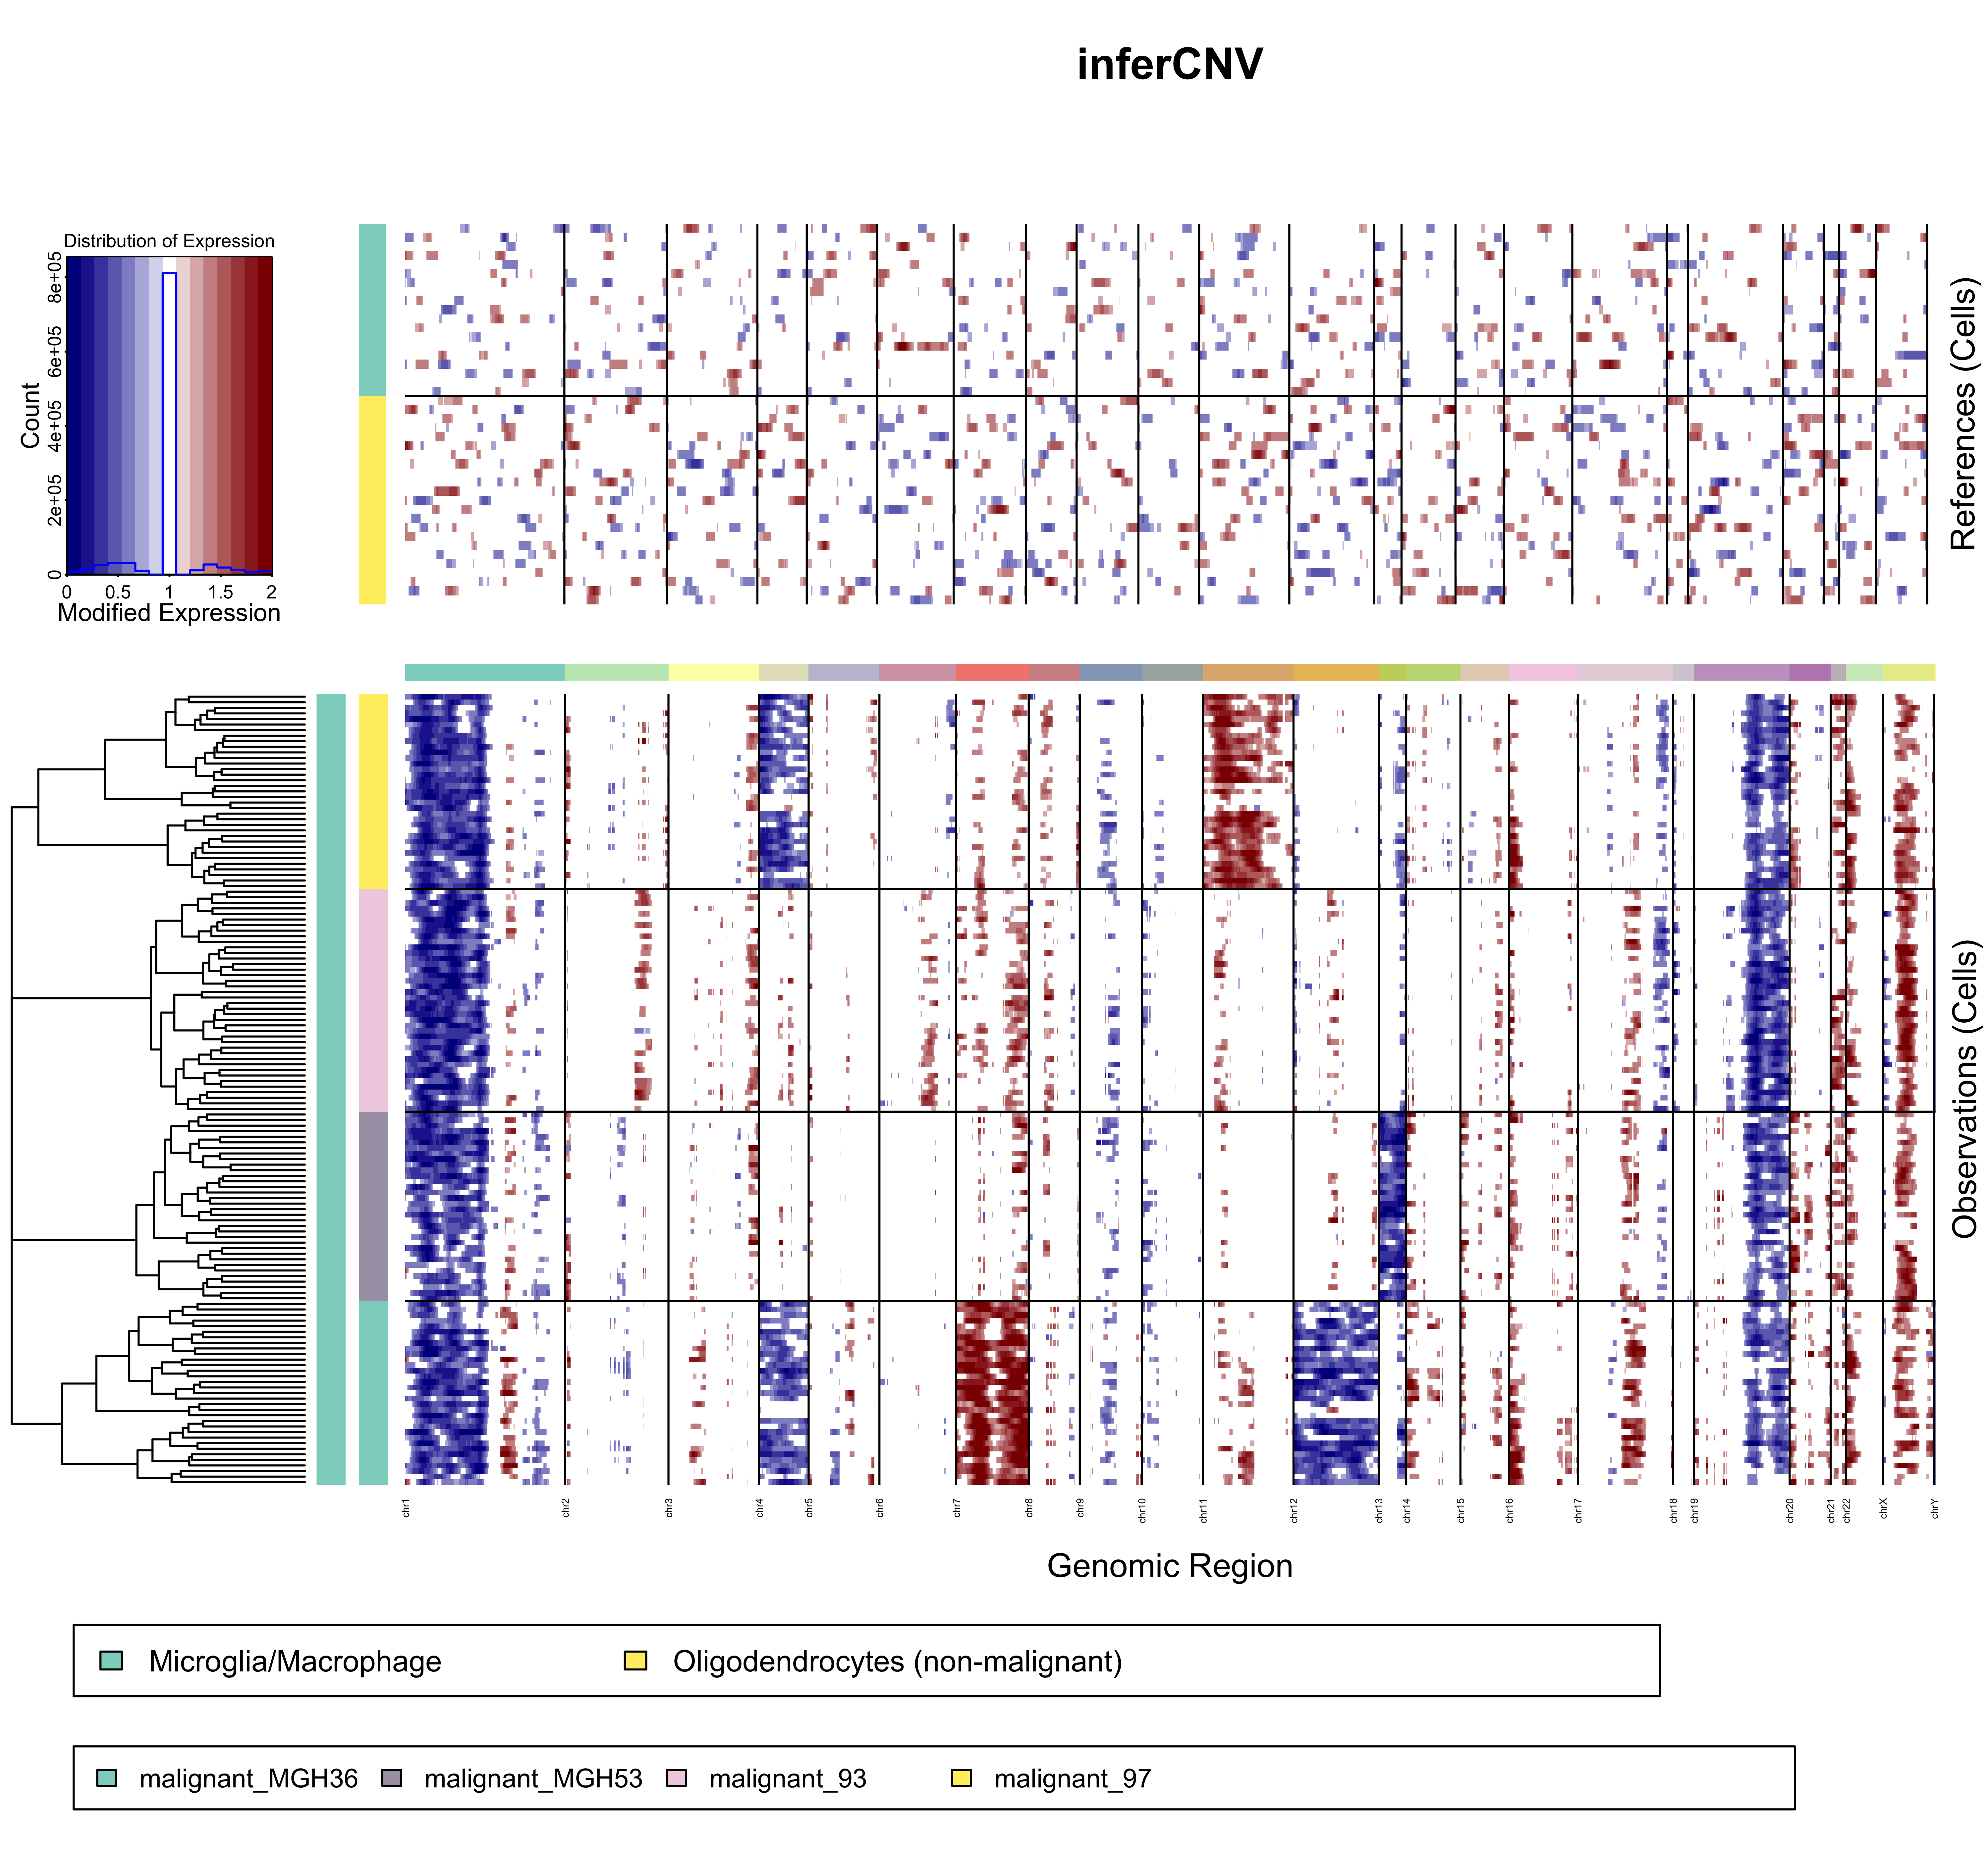
This will run inferCNV on test example data and should produce the figure at the bottom of this page.
- JAGS
- R (tested in R version 3.6.0 (2019-04-26) -- "Planting of a Tree")
- R libraries required include: graphics, grDevices, RColorBrewer, gplots, futile.logger, stats, utils, methods, ape, Matrix, fastcluster, dplyr, HiddenMarkov, ggplot2, edgeR, coin, caTools, digest, reshape, rjags, fitdistrplus, future, foreach, doParallel, BiocGenerics, SummarizedExperiment, SingleCellExperiment, tidyr, parallel, coda, gridExtra, argparse
- Python 3 (optional, for some input preparation scripts)
inferCNV requires:
- a raw counts matrix of single-cell RNA-Seq expression
- an annotations file which indicates which cells are tumor vs. normal.
- a gene/chromosome positions file
See the above example to explore the example inputs provided. These required inputs are described in more detail here.
Please use the following citation:
inferCNV of the Trinity CTAT Project. https://github.com/broadinstitute/inferCNV
This methodology was leveraged in these earlier studies, which inspired the development of the inferCNV software:
The following figure should be produced by the Quick Start instructions. This figure shows scRNA-Seq expression of oligodendroglioma with hallmark chr 1p and 19q deletions.

Now that you've gotten the example to work, use the menu in the upper right to navigate to the more detailed descriptions and instructions for exploring your own data.
Please connect with us on our Trinity-CTAT forum at https://groups.google.com/forum/#!forum/trinity_ctat_users
Funding for the inferCNV project is provided by NCI ITCR as part of the Trinity CTAT Project.
- InferCNV Home
- Quick Start
- Installing inferCNV
- Running InferCNV
- Applying Noise Filters
- Predicting CNV via HMM
- Bayesian Mixture Model
- Tumor heterogeneity - define tumor subclusters
- Interpreting the Figure
- Inputs to InferCNV
- Outputs from InferCNV
- More inferCNV example data sets
- Using 10x data
- Interactively navigating data using the Next Generation Heatmap Viewer
- Extracting HMM features
- FAQ and common issues