Operation
Before using Hagfish you'll need to align the read pairs against the genome. Note that you need paired alignments, and that the readpairs should not be restricted (too much) in the distance that they align from each other (more information here).
If the read mapper does not provide BAM output, it must be converted.
It is important to keep the mappings of sequencing runs from different libraries separate from each other. Hagfish will need to estimate (or be told) what the insert size of the library is - per library.
For proper operation Hagfish will need to know the insert size of each
of the sequenced libraries (i.e. BAM file). Hagfish tries to estimate
the insert size [1]. However - as the results of the Hagfish analysis
strongly depend on the these values it is recommended to inspect these
manually. hagfish_extract generates histograms of the observed
insert size in a stats directory. It is possible to run
hagfish_extract (see next topic) on a subset of the data using the
-x command line argument.
The histograms can be found in the stats/ subfolder once hagfish_extract has finished.
An example histogram [2] is:
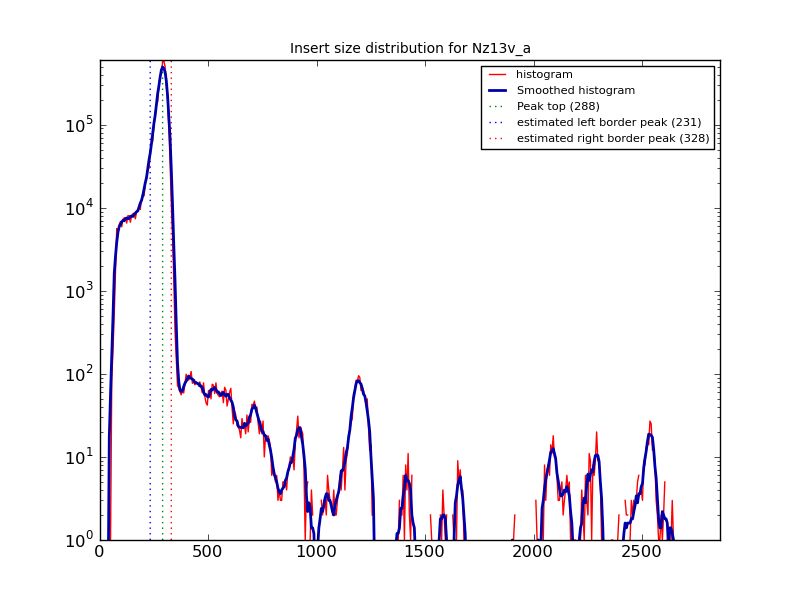
A plot like this is generated for each BAM file analysed. In the plot
above, the estimate is about correct, but you should ALWAYS
check. If the plot reveals that Hagfish has not predicted the insert
size correctly - you can manually define these using --low VALUE and
--high VALUE.
Once you have one, or more, BAM files (note - one per library/lane - do not mix them) you can start using Hagfish. Hagfish must be consistently executed from a specific directory as it creates, and expects, a number of files and directories.
The first step is to extract the hagfish coverage plots per sequence/library. This is done using hagfish_extract:
hagfish_extract ../alignment_files/*.bam
or:
hagfish_extract ../alignment_files/lib1.bam &
hagfish_extract ../alignment_files/lib2.bam &
hagfish_extract ../alignment_files/lib3.bam &
if you want to extract multiple files in parallel (which is possible).
Hagfish will generate a few more directories and extract the separate coverage plots, for each of the libraries, in these.
The following directories will be created: seqInfo/ - Hagfish stores information about the entire bam-file in there so the bam-file doesn't have to be parsed in subsequent Hagfish-runs. When the bam-file is faulty and has to be re-generated the relevant file in this directory has to be deleted or moved. readpairs/ - Information about readpairs, for each aligned sequence 4 files. stats/ - Contains normal, log and log2-insert-size plots for each bam-file as well as a general stats-file containing some information about the bam-file used.
Once all initial extraction steps have finished, the output needs to be combined into one overall file (per input sequence) using (in the hagfish working directory):
hagfish_coverage_combine
These steps can take a while to process, depending on the amount of
input data & the number of scaffolds in the reference sequence, so consider using screen or similar to avoid loss of data.
Once all data is process you can start generating coverage plots using
hagfish_cplot <SEQID>
or
hagfish_cplot2 <SEQID>
where is the name of the sequence you aligned reads to. Check the subfolder combined/ to see for which sequences hagfish_extract extracted information and which names you can use.
Also try:
hagfish_cplot2 --help
to see what parameters there are to play with.
The standard name of the generated file is:
<Name of the sequence the reads are aligned to>_<start on the sequence>_<end of the sequence>_<type: cplot|block|cplot2..>.png
for example: Chr1_1000_20000_cplot2.png
Hagfish is able to plot identify, and later plot sequence gaps, as
long as those gaps are encoded by stretches of NNs in the reference
sequence. The hagfish_cplot2 and hagfish_blockplot script make
automatic use of gap information, once it it generated using the
following command line:
hagfish_gapfinder -f </PATH/TO/USED/REFERENCE.fasta>
Note - this must be executed after hagfish_extract, since the script checks if the observed sequence lengths are the same as the lengths found by hagfish_extract. The gap-information is stored in the subfolder gaps/ - so if the data is not correctly parsed in a plotting-run check whether the contig-names of the files correspond to the contig-names in the bam-alignment.
It can be a daunting task to manually go through all plots - certainly in a large project. Hagfish has the ability to identify regions that are potentially problematic based on the Hagfish score. The Hagfish score is calculated by:
[ S_i = 1 - 2e^{ -m \cdot o_{i}} + e^{ -m \cdot a_{i}} ]
with
- [S_i] the score on location i
- [o_i] the coverage in the 'ok' category on position i
- [a_i] the combined coverage of the 'low' and 'high' categories on postion i
- [m] one divided by the median coverage in the 'ok' category.
The score has the following properties: Regions that have sufficient 'ok' coverage get a score close to 1 - even if there is 'low' and/or 'high' coverage at that same location. If there is a lot of 'low' and/or 'high' coverage, and little 'ok' coverage, the score approaches -1. Anything near zero is either undecided, or has not enough coverage.
Based on the Hagfish score, the hagfish_flatten script can generate
a GFF file categorizing each location into being (using a score cutoff
S, and a coverage cutoff C)
- 'good' (score > S)
- 'bad' (score < -S)
- 'uncertain' (-S < score < S)
- 'nodata' (combined coverage < C)
The output is one GFF file per input sequence in the subdirectory ./flat.
-
Unfortunately - the algorithm is not terribly good at dealing with anomalies - any suggestions for a better algorithm are more than welcome.
-
Hagfish also generates a non-logarithmic plot and log-log plot.