Application Performance M(onitoring|anagement) [APM] wiki
related to: devOps, serviceOps, etc.
tagged: #app-monitoring-task #app-monitoring-tools #app-monitoring-framework #app-moinitoring-solution #app-performance-monitoring
- https://webapplicationmonitoring.net/
- https://smartbear.com/learn/performance-monitoring/why-you-should-be-monitoring/
- https://www.atlassian.com/software/opsgenie
- https://sentry.io/for/performance/
- https://www.nagios.com/solutions/web-application-monitoring/
- https://www.pingdom.com/blog/best-practices-for-web-app-monitoring/
- http://uptimerobot.com/ ( usesd Caddy - The Ultimate Server with Automatic HTTPS )
- https://www.apmdigest.com/the-anatomy-of-apm-4-foundational-elements-to-a-successful-strategy
"APM is "the translation of IT metrics into business meaning ([i.e.] value)"
- https://coralogix.com/log-analytics-blog/apm-comparison/
- https://crozdesk.com/it/application-performance-monitoring-apm-software, https://crozdesk.com/compare/appdynamics-vs-dynatrace-vs-new-relic
- APM is for "application performance management/monitoring"
- measuring-of : 1) user eXperience; 2) resources usage;
- dashboard view(s)
- score index (apdex IDX as [ SAtisfied T ; TOlerating 1' < T < 4': FRustrated T > 4' ] for neW reLiCt; )
- index baseline
- System health issues: 1) events; 2) incidents --> 1) violations; 2) warnings 3) ??
- Root Cause analysis
- MTTD/R / MTTD-R [mean-time to detect AND resolve] parameter
- SIEM [security information and event management] platform
- FrontEnd applications
- BackEnd applications
- Orchestration applications
New Relicis a SaaS platform, whileAppDynamicsandDynatraceoffer [full SaaS, on-prem, and hybrid installation options]
two waysto write your own queries to retrieve data and build charts (Query builder):
- NRQL mode: query using New Relic query language (NRQL), the same language we use to build most of our UI experiences.
- PromQL-style mode: write basic queries using a PromQL-style query.
{ Grafana, Kafka, Graphite, Nagios, etc. are related items }
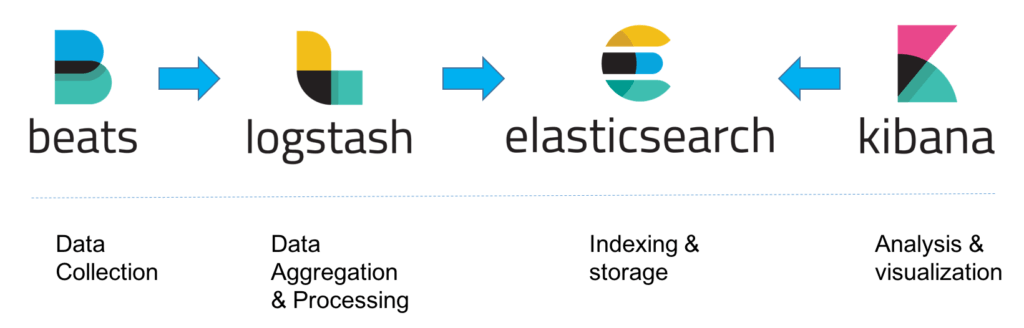
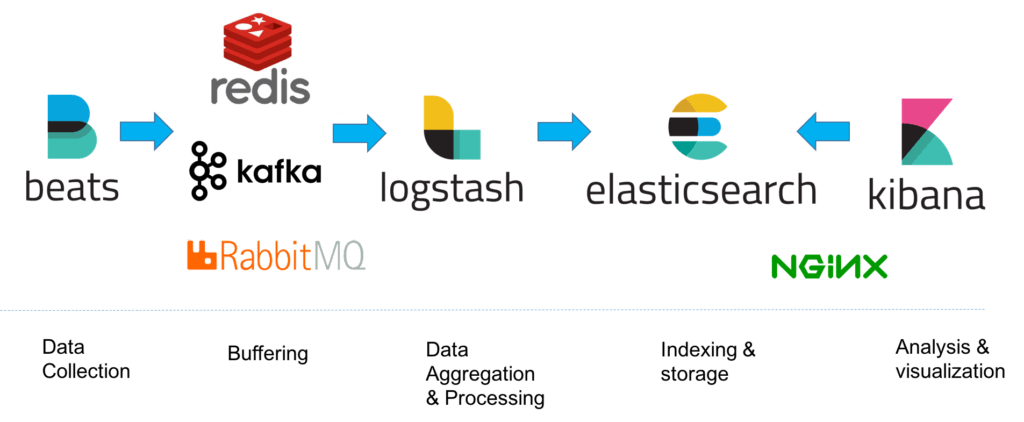
ELK Stack { log analytics platform }was a collection of three open-source products — __E__lasticsearch, __L__ogstash,github, and __K__ibana — all developed, managed and maintained by Elastic. The introduction and subsequent addition of Beats turned the stack into a four-legged project and led to a renaming of the stack as the**Elastic Stack**.Elasticsearchis NoSQL database that uses the Lucene search engine.Logstashis a data processing and transportation pipeline used to populate Elasticsearch with the data (though also it supports other destinations including Graphite, Kafka, Nagios and RabbitMQ). Kibana is a dashboard that works on top of Elasticsearch. Kibana query is based on the Lucene query syntax. :green_book: small-size ELK, PNG-diagram 📙 more complex ELK, PNG-diagram
There are many
varieties of ELK:
- The open-source ELK Stack platform (on Elastic)
- Hosted Elasticsearch (AWS) : installing ELK on Ubuntu, accessing by SSH and TCP 5601 (Kibana)
- AI-powered ELK on an enterprise-grade platform (on Logz.io)
Monitoring Applications with Elasticsearch and Elastic APM 🏹
- usage of Kibana [logs-related]:
- Query string query | Elasticsearch Guide [7.13]
- Free on-demand Elasticsearch and Kibana Training [ \Quick Starts \ How-to \ Fundamentals sections ]
- SPLUNK { forwarder --> indexer --> search head ; uses its own Splunk Search Processing Language (SPL) which supports the search pipeline - consecutive commands are chained together using a pipe character }
ELK Stack provides
role-based securityas a separate paid tool. Splunk and managed-ELK services offeruser managementout of the box with user auditing included.
comparisions:
- https://stackshare.io/stackups/logz-io-vs-splunk-enterprise-vs-logstash
- https://devops.com/splunk-elk-stack-side-side-comparison/
- https://www.getapp.com/business-intelligence-analytics-software/a/logz-io/compare/splunk-enterprise/